Metrics Dashboard
RapidFire AI offers a browser-based dashboard to automatically visualize all AI metrics and lets you control runs on the fly from there. Our current default dashboard is a fork of the popular OSS tool MLflow, and it inherits much of MLflow’s native features. The dashboard URI is printed when the rapidfireai server is started; open it in a browser.
As of this writing, apart from MLflow, RapidFire AI also supports TensorBoard and Trackio for logging metrics plots. Specify any one, two, or all three dashboards to use with the following server start argument.
rapidfireai start --tracking-backends [mlflow | tensorboard | trackio]
Alternatively, set the dashboard using its environment variable as below in your python code/notebook:
os.environ["RF_MLFLOW_ENABLED"] = "true"
os.environ["RF_TENSORBOARD_ENABLED"] = "true"
os.environ["RF_TRACKIO_ENABLED"] = "true"
Note
The MLflow-fork dashboard and its Traces logging are served on port 8852 (configurable via RF_MLFLOW_PORT). The RF_MLFLOW_ENABLED variable toggles this MLflow backend together with its Traces logging. It defaults to true on local and cloud machines and false on Google Colab. Set RF_MLFLOW_ENABLED=false to disable MLflow and Traces logging — for example on Colab (where the in-notebook table is used instead), or to avoid binding port 8852.
Support for other popular dashboards such as Weights & Biases and CometML is coming soon. The rest of this section explains the new features of our MLflow-fork dashboard. Note that these new features are not yet available on the other dashboards.
Tabs in the Dashboard
The main “Experiments” page on the dashboard has 4 main tabs:
Table
Chart
Experiment Log
Interactive Control (IC) Log
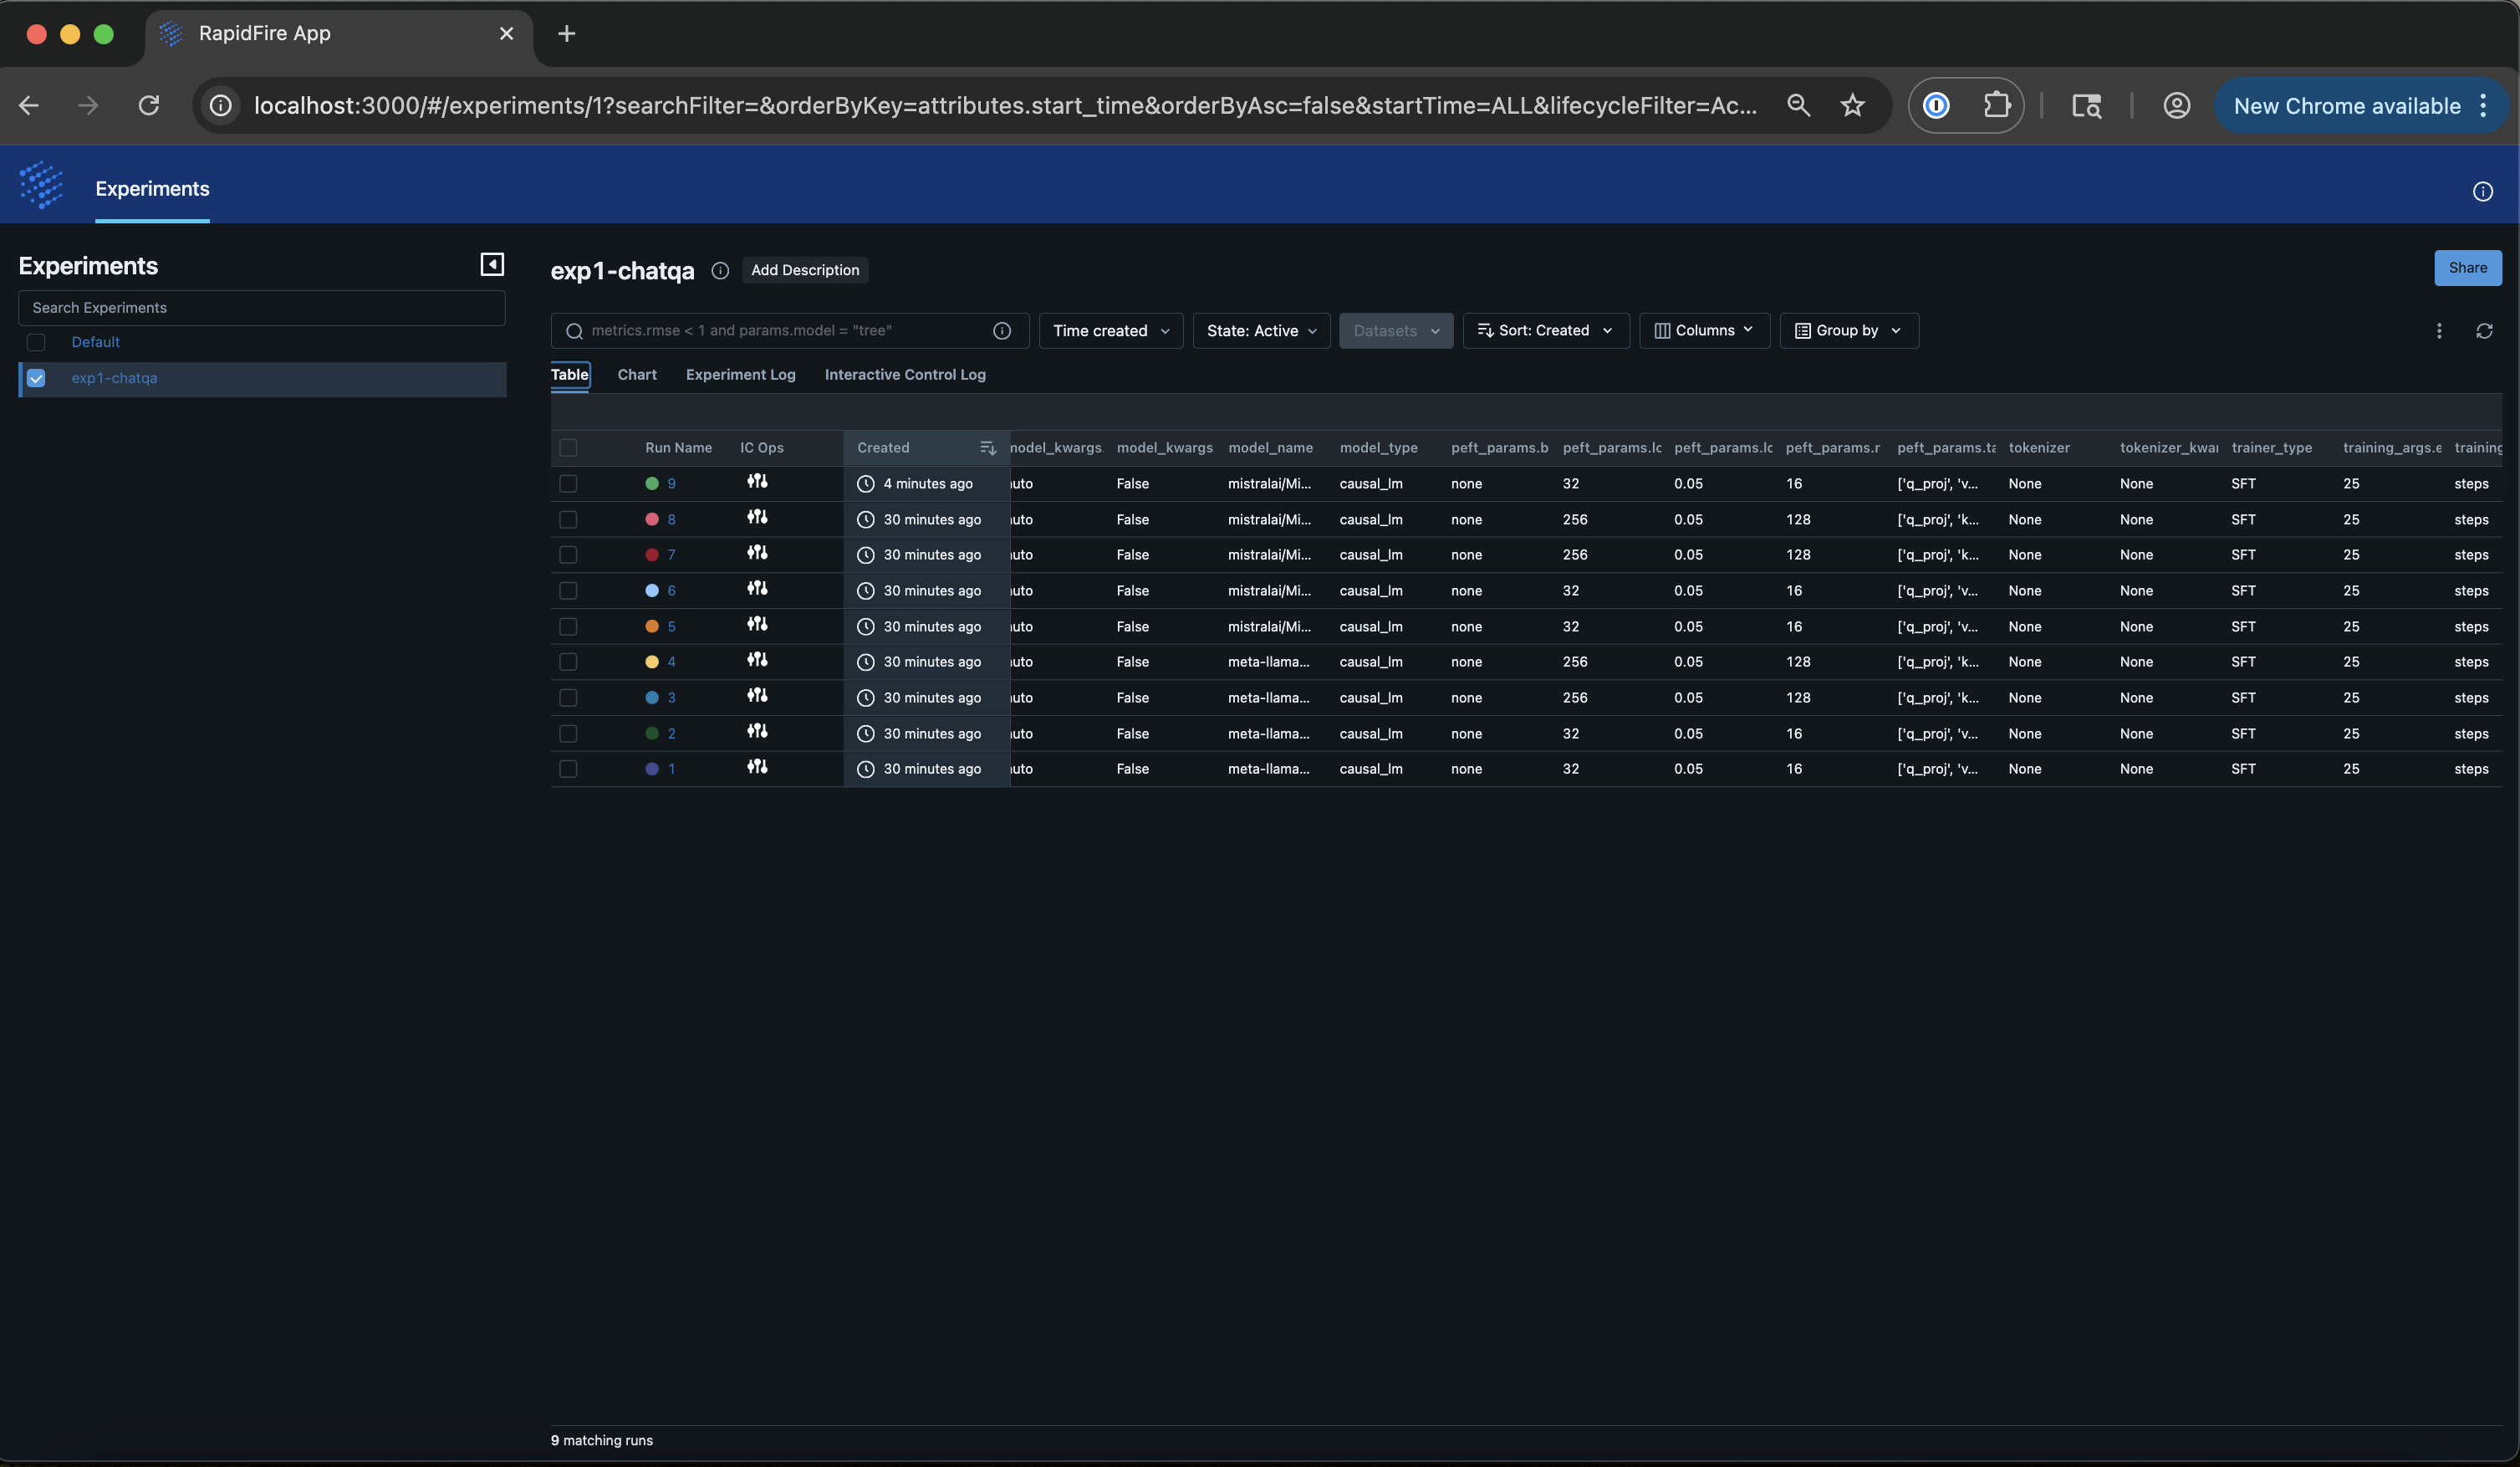
The screenshot below shows the “Table” view of an experiment with all its runs. Each run represents one model with one set of config knob values, which is standard dashboard semantics.
Metrics Plots
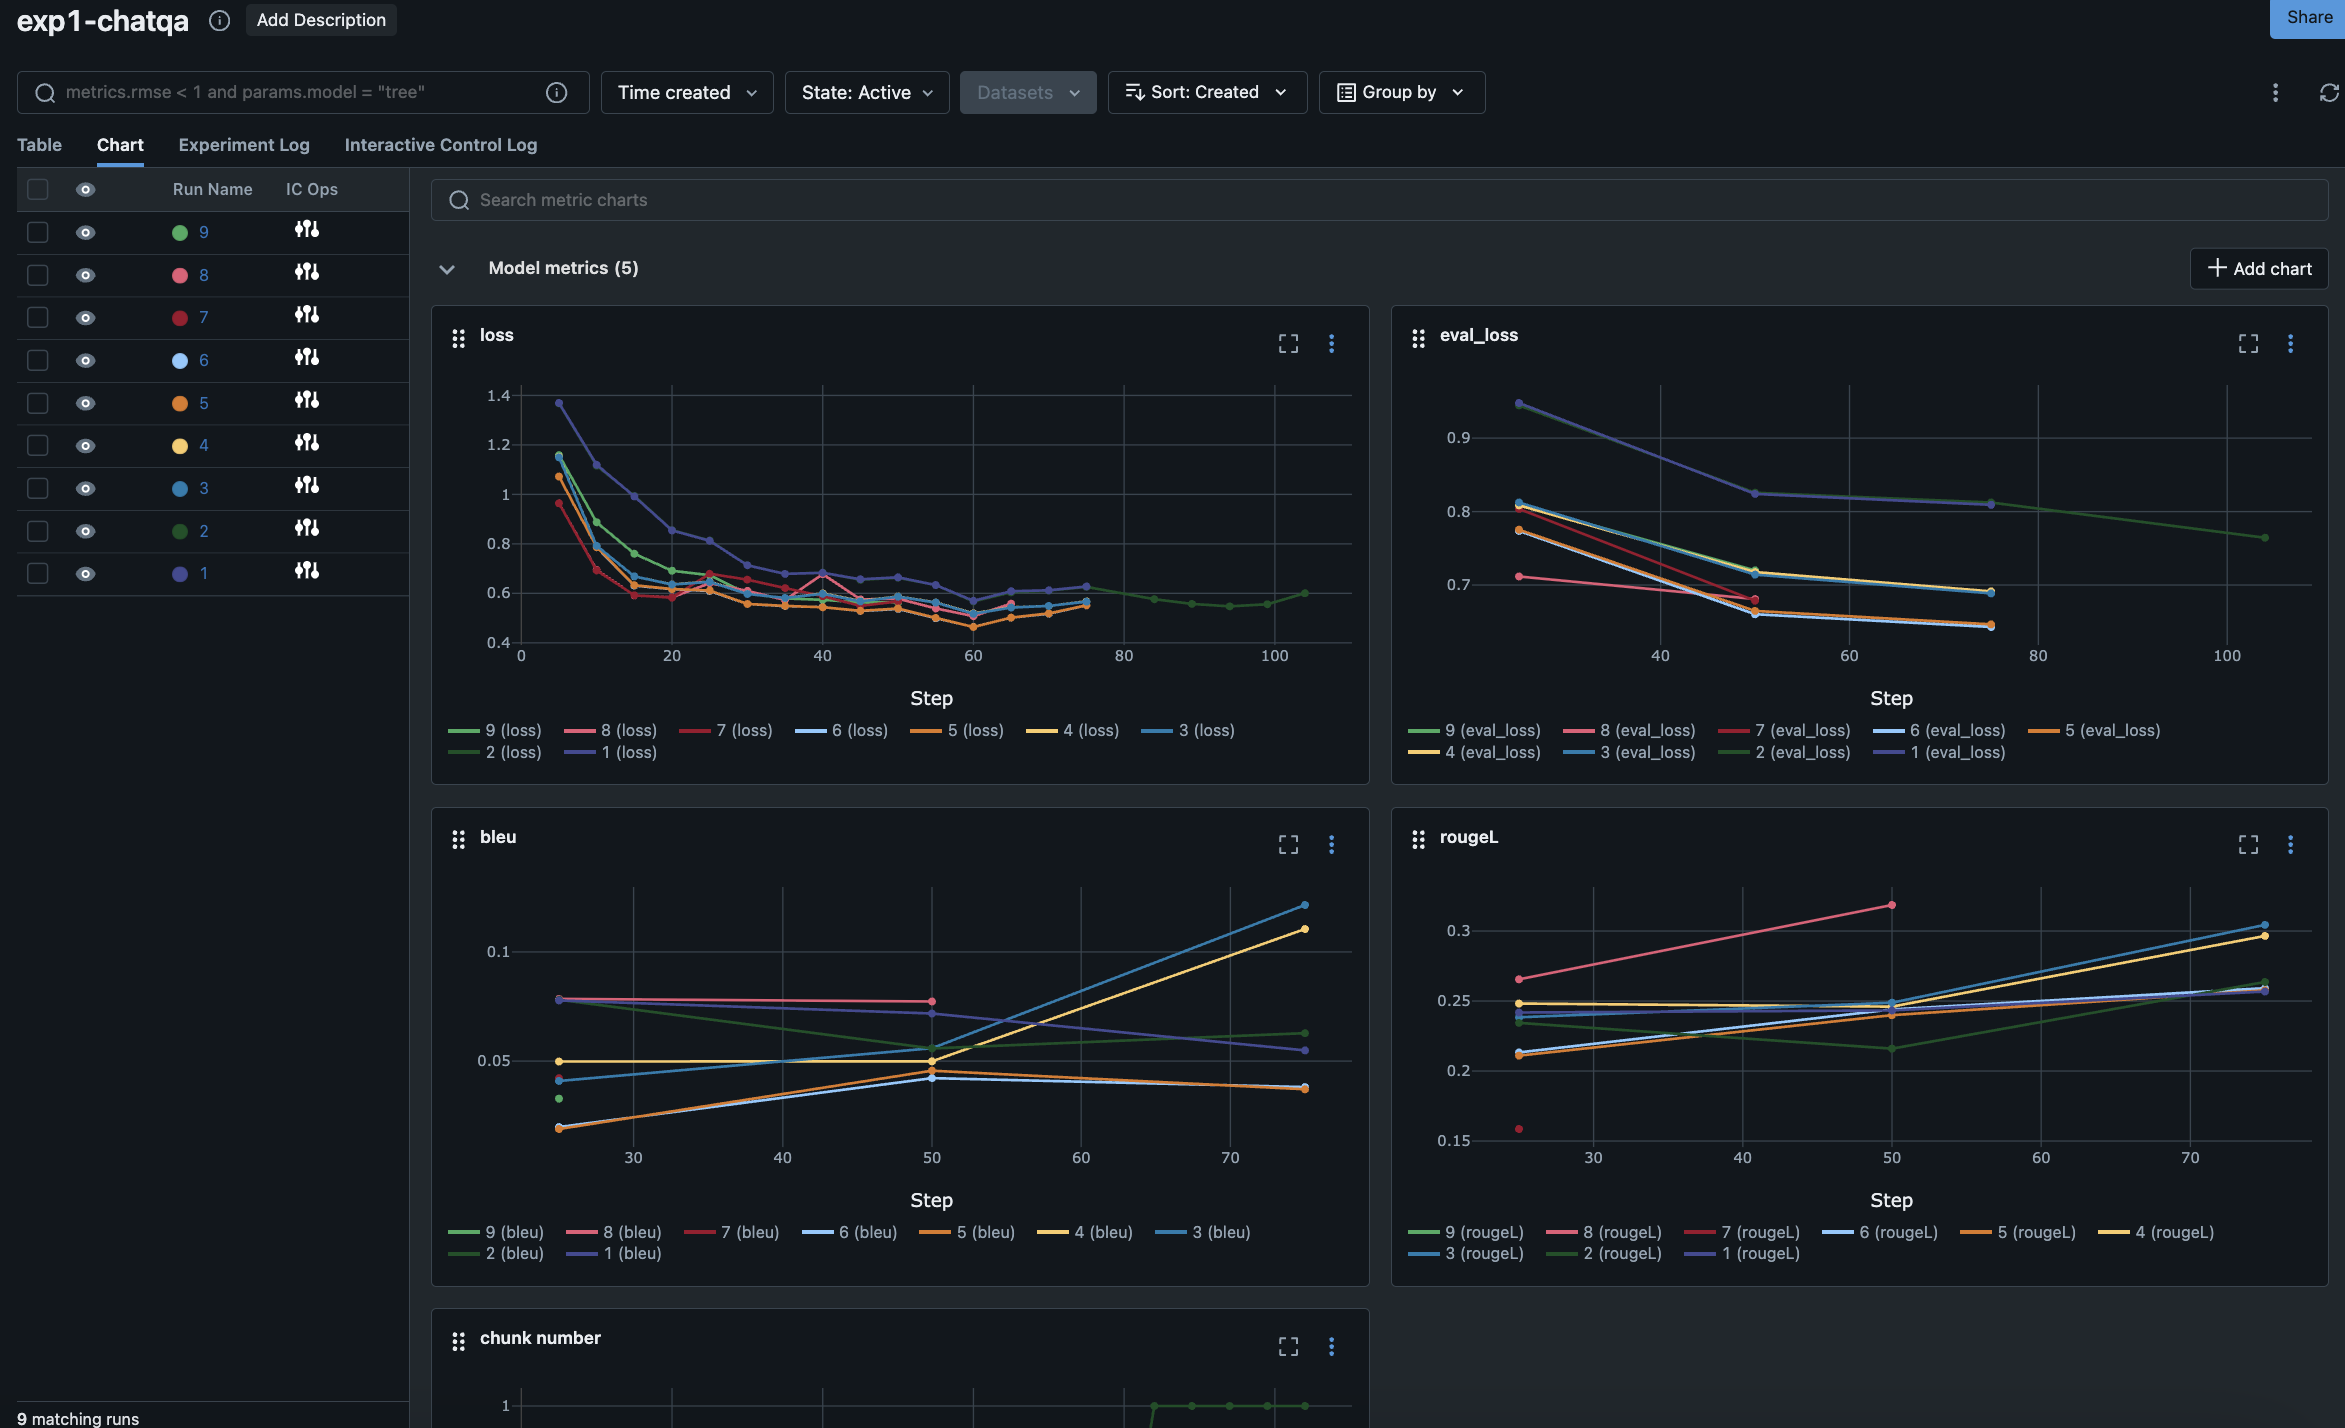
The screenshot below shows the “Chart” view of an experiment with all its runs.
Each plot corresponds to a metric, spanning loss on the training set and evaluation set,
as well all named metrics returned in your compute_metrics() function in the trainer config.
We call attention to 3 key aspects of the visualizations here:
The x-axis “Step” for the mini batch-level plots represents absolute number of minibatches seen by that run. So, if the
batch_sizeis different for different runs in your experiment, they will take different numbers of steps and the curves will not line up till the end. This is not a bug but the expected correct behavior.The x-axis “Step” for the epoch-level plots represents absolute number of epochs seen by that run. So, if the
epochsis different for different runs in your experiment, they will take different numbers of steps again as above.Please refresh the browser page to get RapidFire AI’s metrics reader to pull the latest data entries from the metrics files.
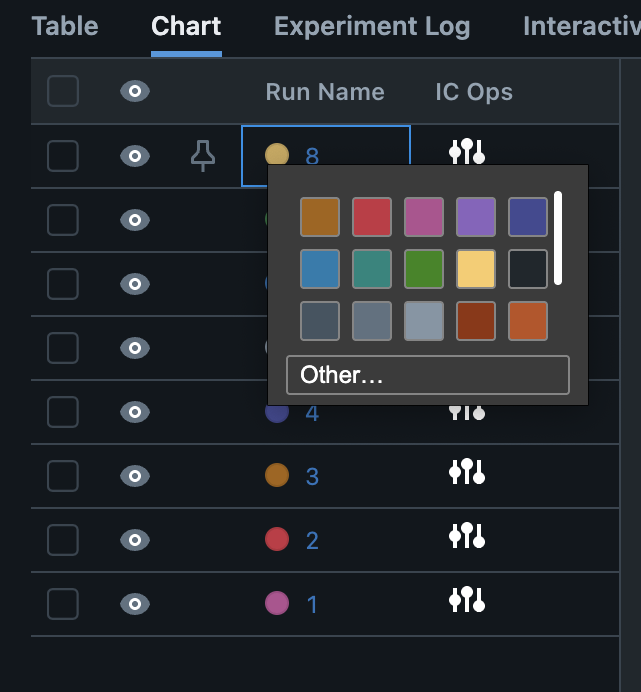
The dashboard picks some default colors for all runs, but you can change their colors by clicking the “color circle” next to the run number in the “Run Name” column. A color palette will pop up as shown in the screenshot below.
Message Logs
There are two continually appending message logs on the third and fourth tabs: “Experiment Log” and “Interactive Control Log”, respectively. All operations you run with RapidFire AI’s API will be displayed on the former. The latter will specifically display all the Interactive Control (IC) operations you do via the IC Ops panels, as shown on the screenshot below.
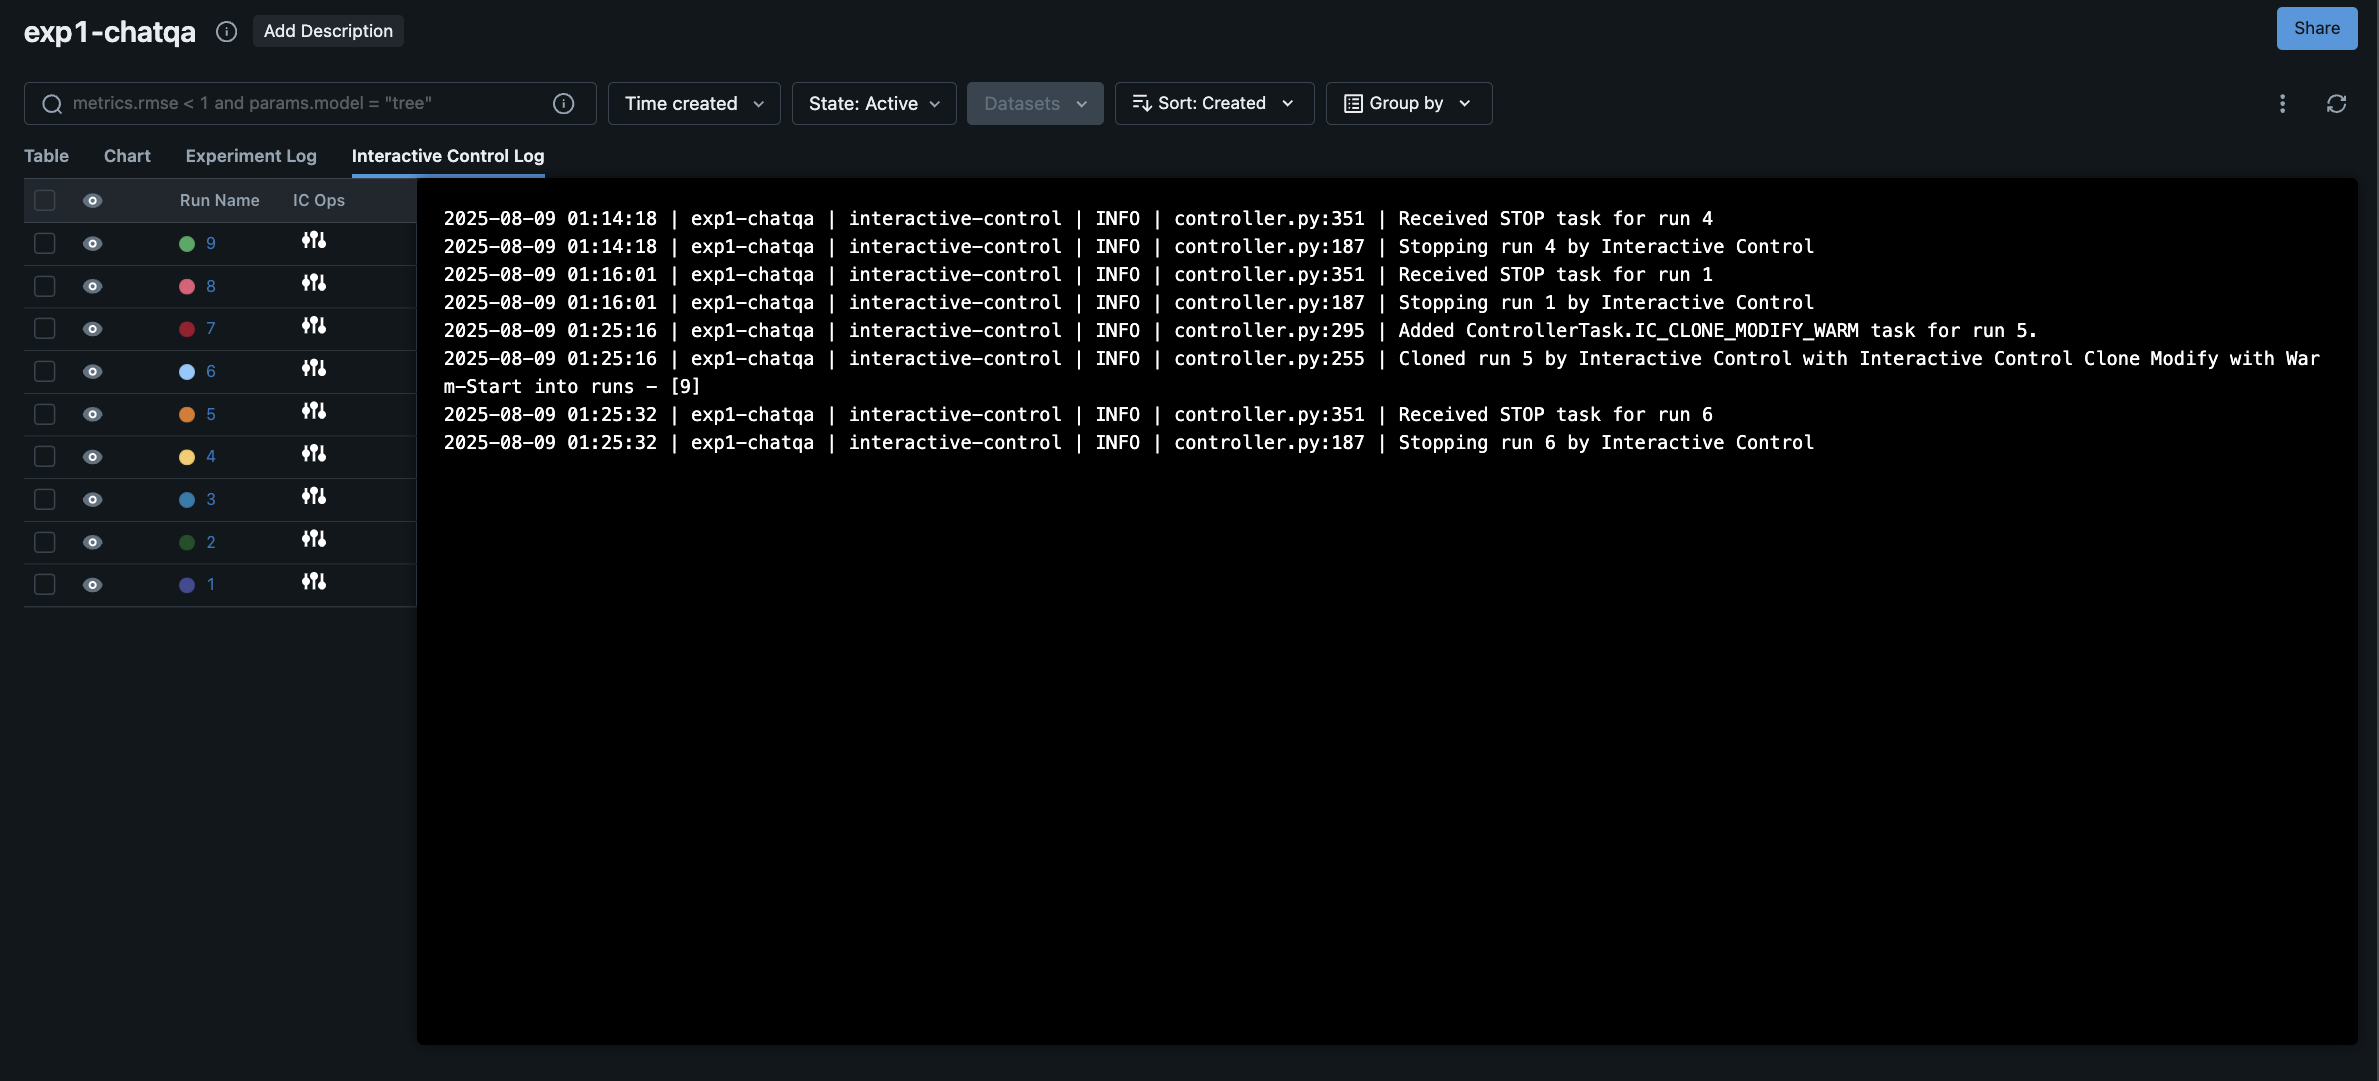
The full experiment log will also be available as a text file saved on your local directory under the name “rapidfire.log”.
Traces Logging and UI
For RAG / context-engineering with run_evals(), RapidFire AI logs a detailed
execution trace for each batch of queries in addition to the metrics. A trace captures the full
path of a query batch through the RAG pipeline so you can inspect exactly what was retrieved, how the
context was assembled, what prompt the generator saw, and what it produced. Traces are grouped under
the experiment, alongside its metrics.
Traces are recorded via MLflow Tracing and shown in the MLflow-fork dashboard. They are active whenever
the MLflow backend is enabled (RF_MLFLOW_ENABLED=true, the default on local and cloud machines)
and the MLflow server is reachable on port 8852. If MLflow is disabled (e.g., the default on Google
Colab) or the server is unreachable, tracing is automatically turned off as a no-op for that session.
See the RF_MLFLOW_ENABLED note earlier on this page.
What Gets Traced
RapidFire AI instruments the pipeline with its own spans for the top-level
rag_pipeline and preprocess steps, plus get_context, retrieve_documents,
rerank_documents, and serialize_documents (the last two appear when a reranker and
serialization are applied). The generator call is traced for both backends:
Self-hosted vLLM is captured by a RapidFire
vllm_generatespan that records the prompts, the generated text, and token counts.API-based generators (OpenAI, Gemini, Anthropic, or any OpenAI-compatible endpoint) are captured
through MLflow autologging, which additionally records the structured System / User / Assistant messages and model parameters.
MLflow autologging also captures the underlying LangChain retriever and embedding calls
(e.g., VectorStoreRetriever and Models.embed_content). Each trace records the input
queries, the retrieved documents (with their source paths), the assembled prompt, the generator model and
sampling parameters (e.g., model, max_completion_tokens), the token count, the latency,
and the generated output.
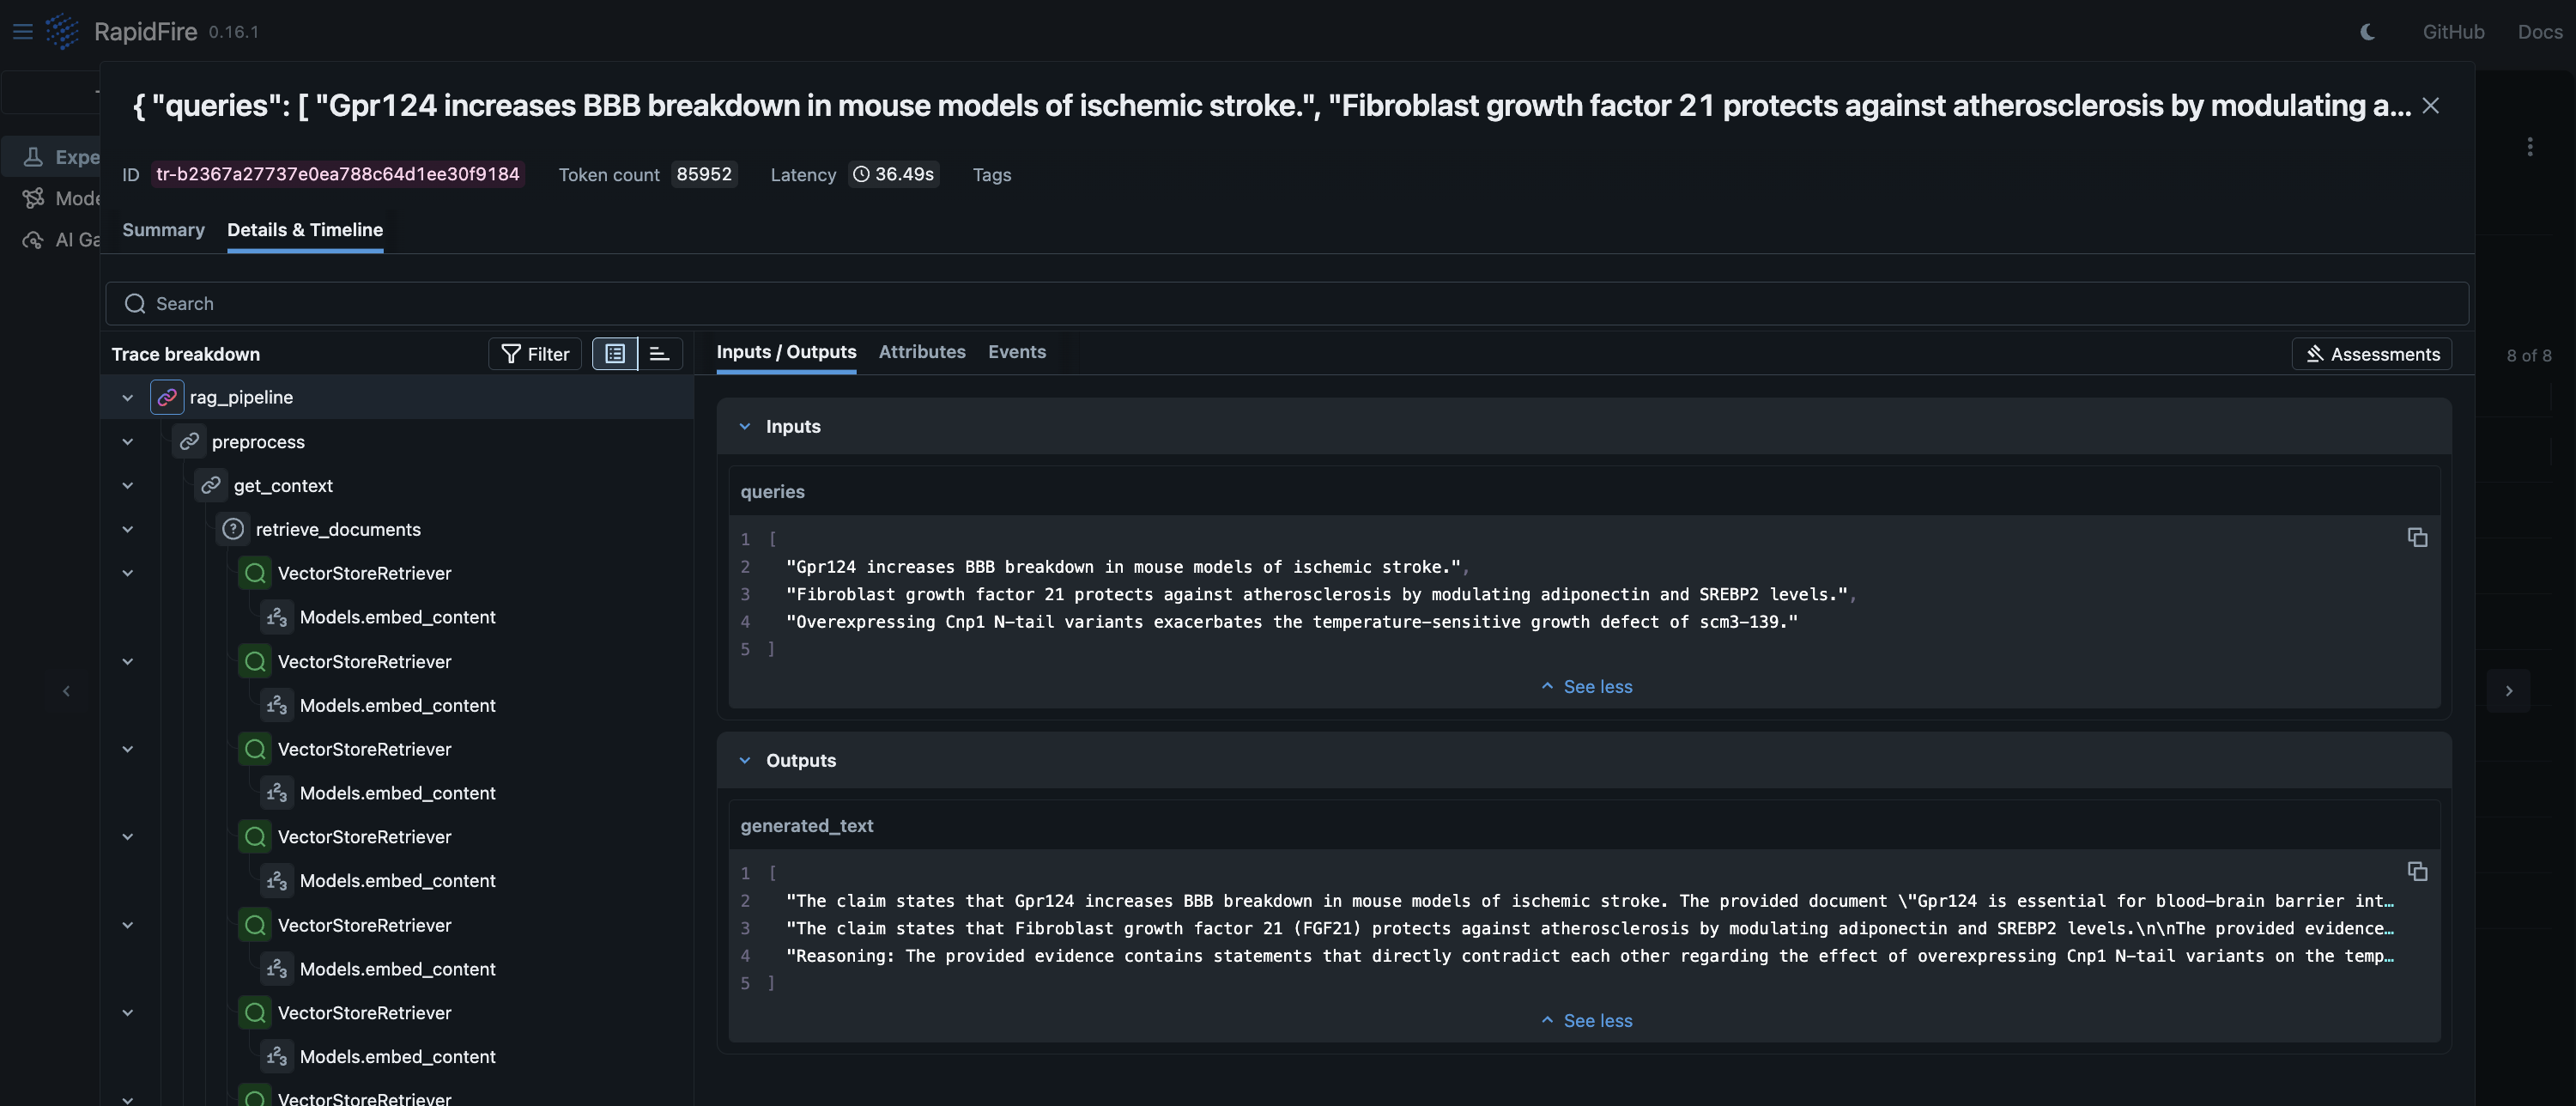
Details & Timeline Tab
Open a trace from any single run’s dashboard (click on the run ID) to see it in a modal headed by the queries,
along with the trace ID, token count, and latency. The “Details & Timeline” tab shows a Trace breakdown
tree of all spans, e.g., rag_pipeline -> preprocess -> get_context ->
retrieve_documents -> VectorStoreRetriever -> Models.embed_content.
Selecting any span shows its Inputs / Outputs, Attributes, and Events in the right-hand pane.
Summary View
The “Summary” tab gives a flat, readable view of the whole batch: the input queries, each retriever call with the documents it returned (and their source files), the generator’s System / User / Assistant messages, the model and its parameters, and the final generated answer. Use the Default / JSON toggle to switch between the formatted and raw views.
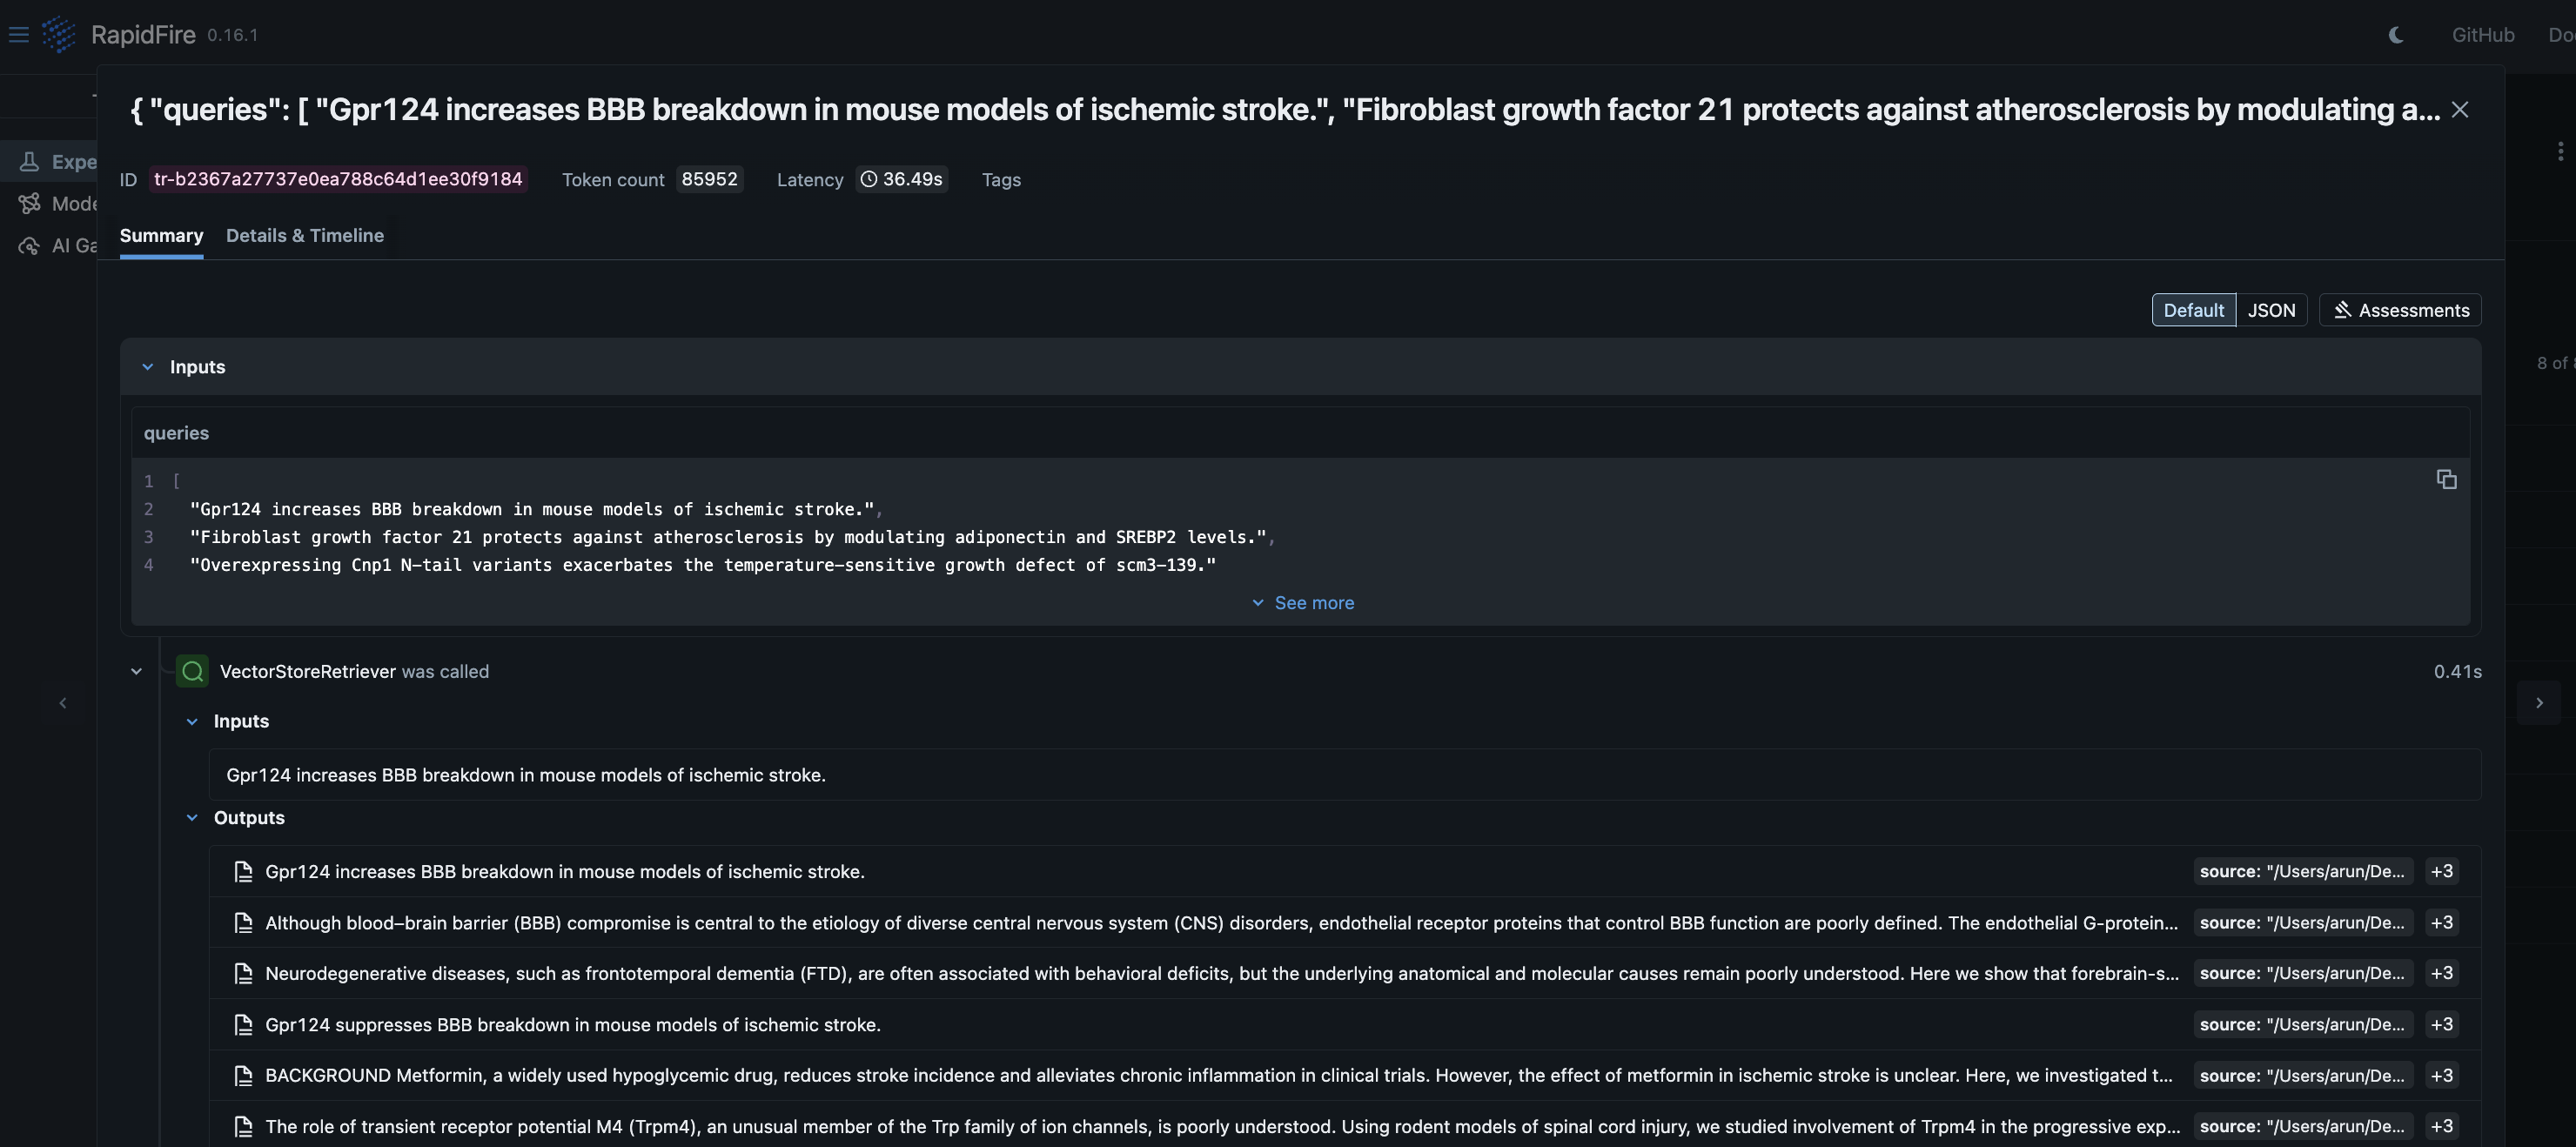
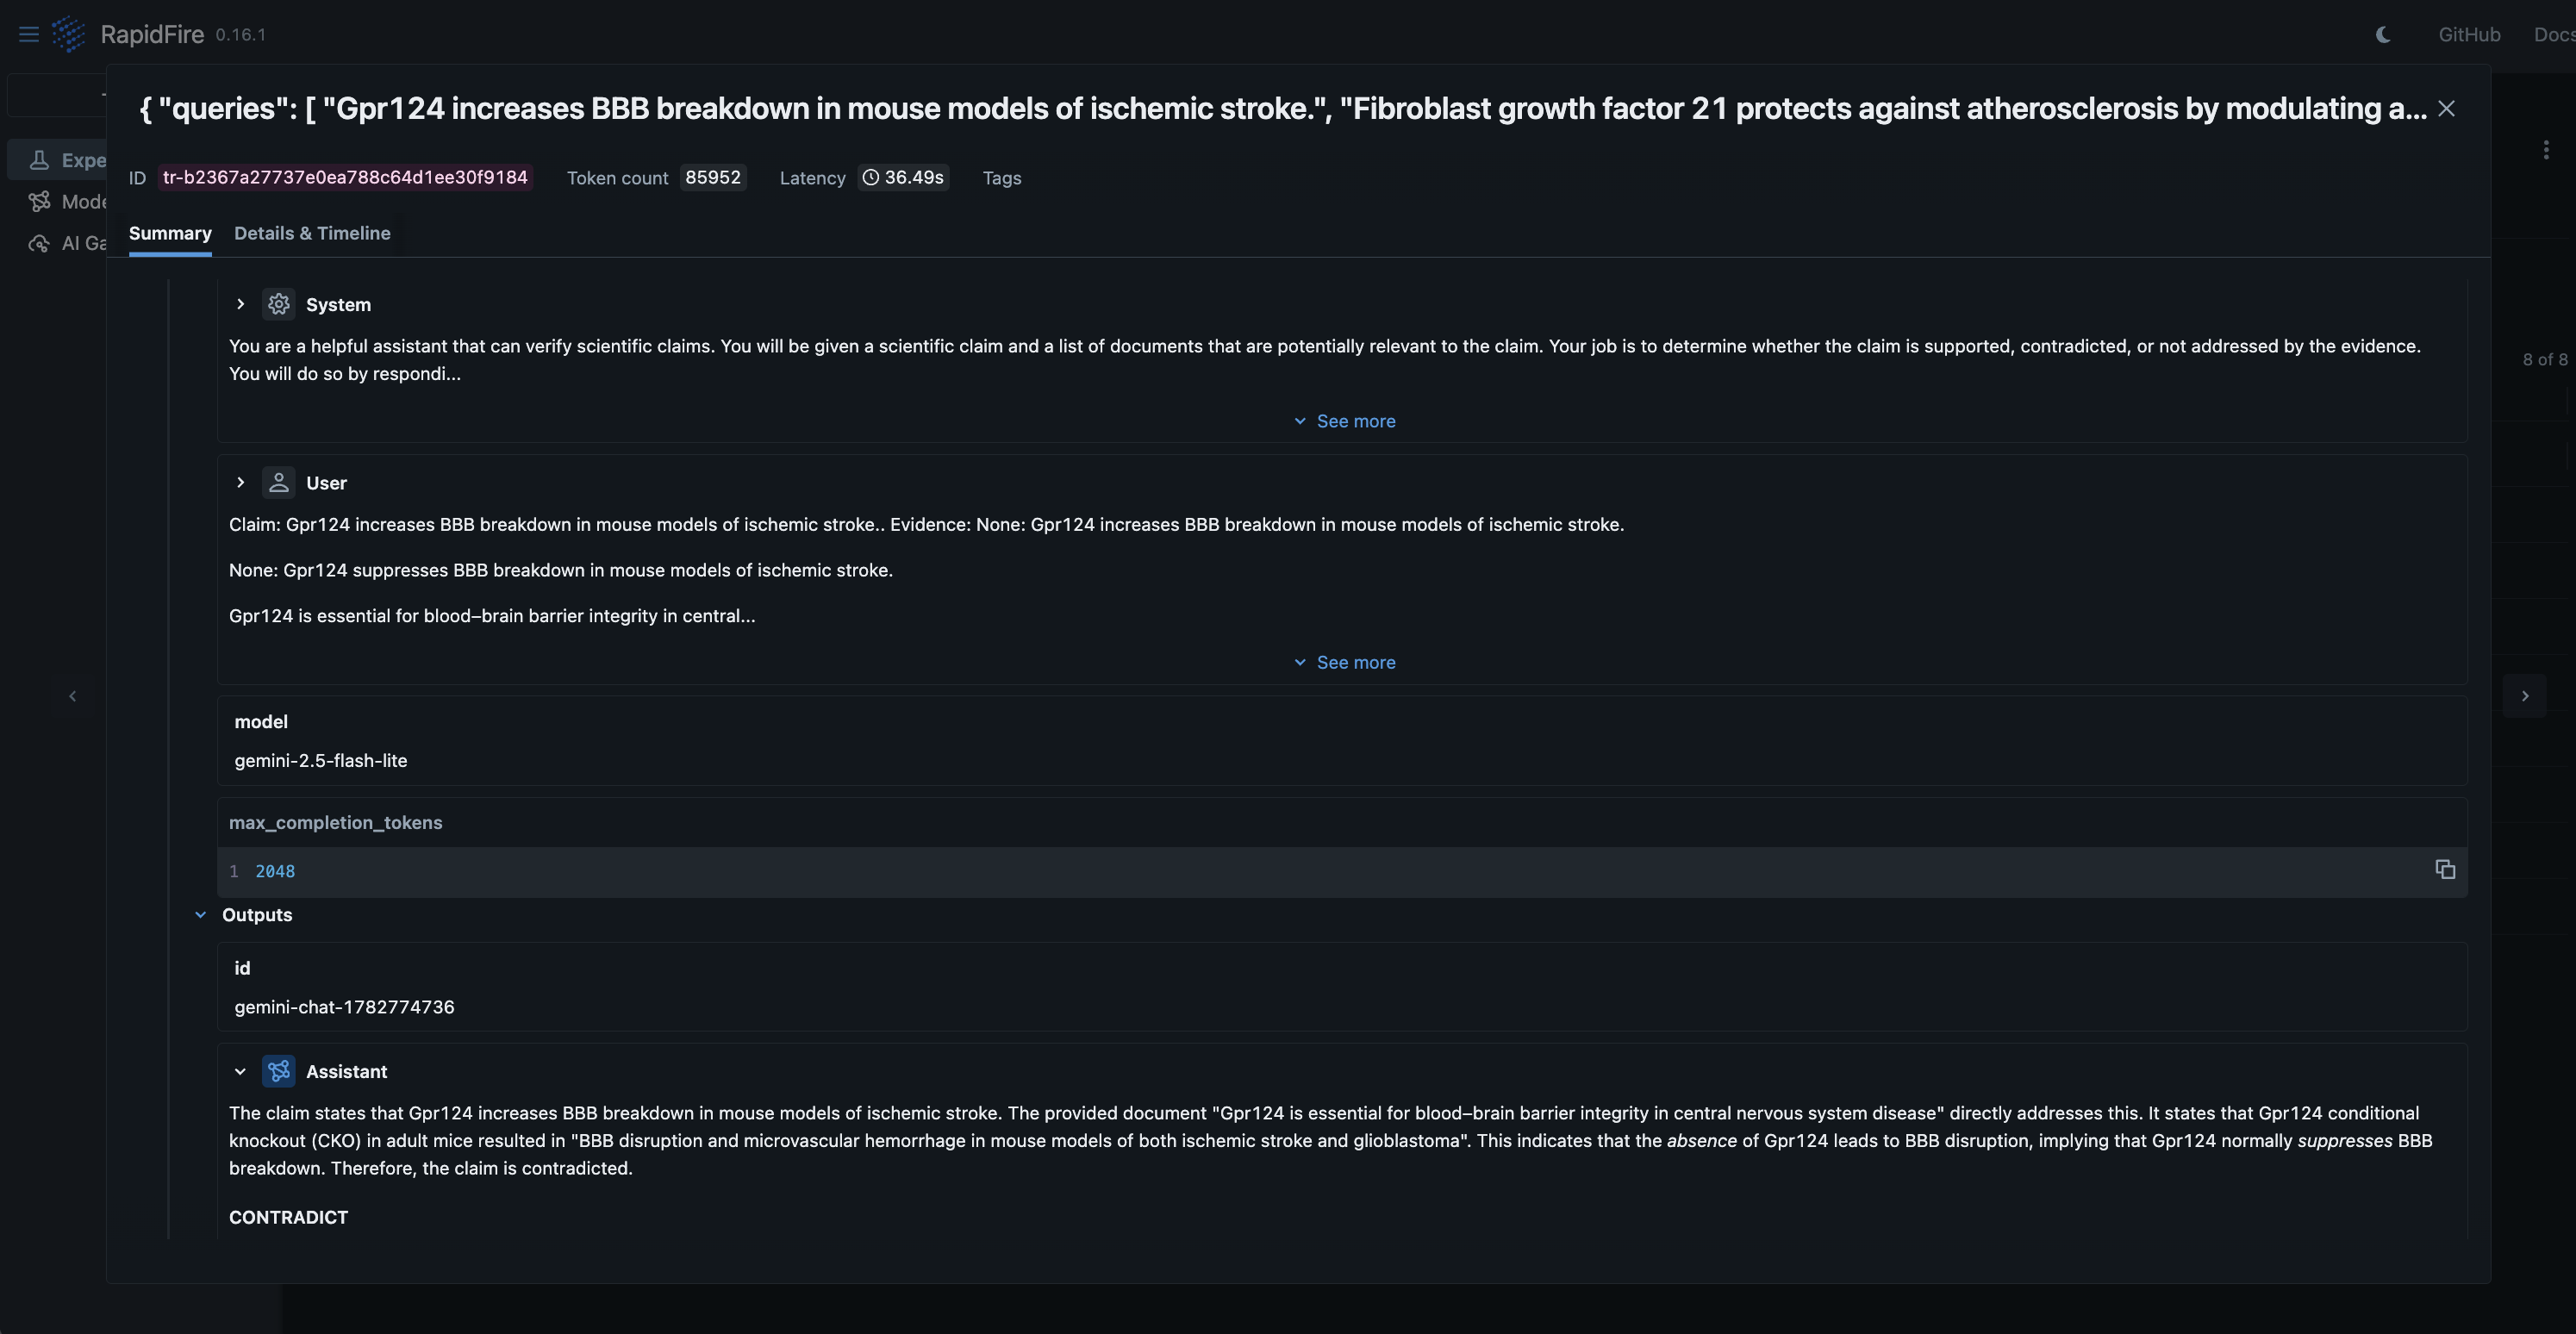
The Summary view above shows an API generator (Gemini), so the generation appears as structured
System / User / Assistant messages. With a self-hosted vLLM generator, the generation instead appears
as a vllm_generate span with the prompt and generated text.
An Assessments panel is also available for attaching evaluations or annotations to a trace. Usage from API-based generators routed through the MLflow AI Gateway is traced as well, so you can review token usage and latency per call.