AI Gateway
For RAG / context-engineering evaluations that use API-based generators, RapidFire AI routes all
provider calls through a built-in AI Gateway. The gateway is a fork of MLflow’s AI Gateway and
gives you a single place to manage provider API keys, define model endpoints, and monitor usage,
latency, and errors across all of your API generators. It is served by the MLflow backend, so it is
available whenever MLflow is enabled (RF_MLFLOW_ENABLED=true, the default on local and cloud
machines) and the server is reachable on port 8852.
Open it from the AI Gateway item in the dashboard’s left navigation. The gateway manages three kinds of resources, each on its own sub-tab: Endpoints, Usage, and API Keys.
The gateway works hand in hand with RFAPIModelConfig. When you construct an
RFAPIModelConfig with an endpoint_config, RapidFire AI provisions the corresponding
API key (secret), model definition, and endpoint in the gateway automatically (creating them if needed
or reusing them if they already exist). You can also create and manage these resources directly in the
UI described below. Also read the API: Generator Configs page.
Supported providers include OpenAI, Google Gemini, Anthropic, and Azure OpenAI, as well as any OpenAI-compatible endpoint reachable via a custom API base URL.
Endpoints
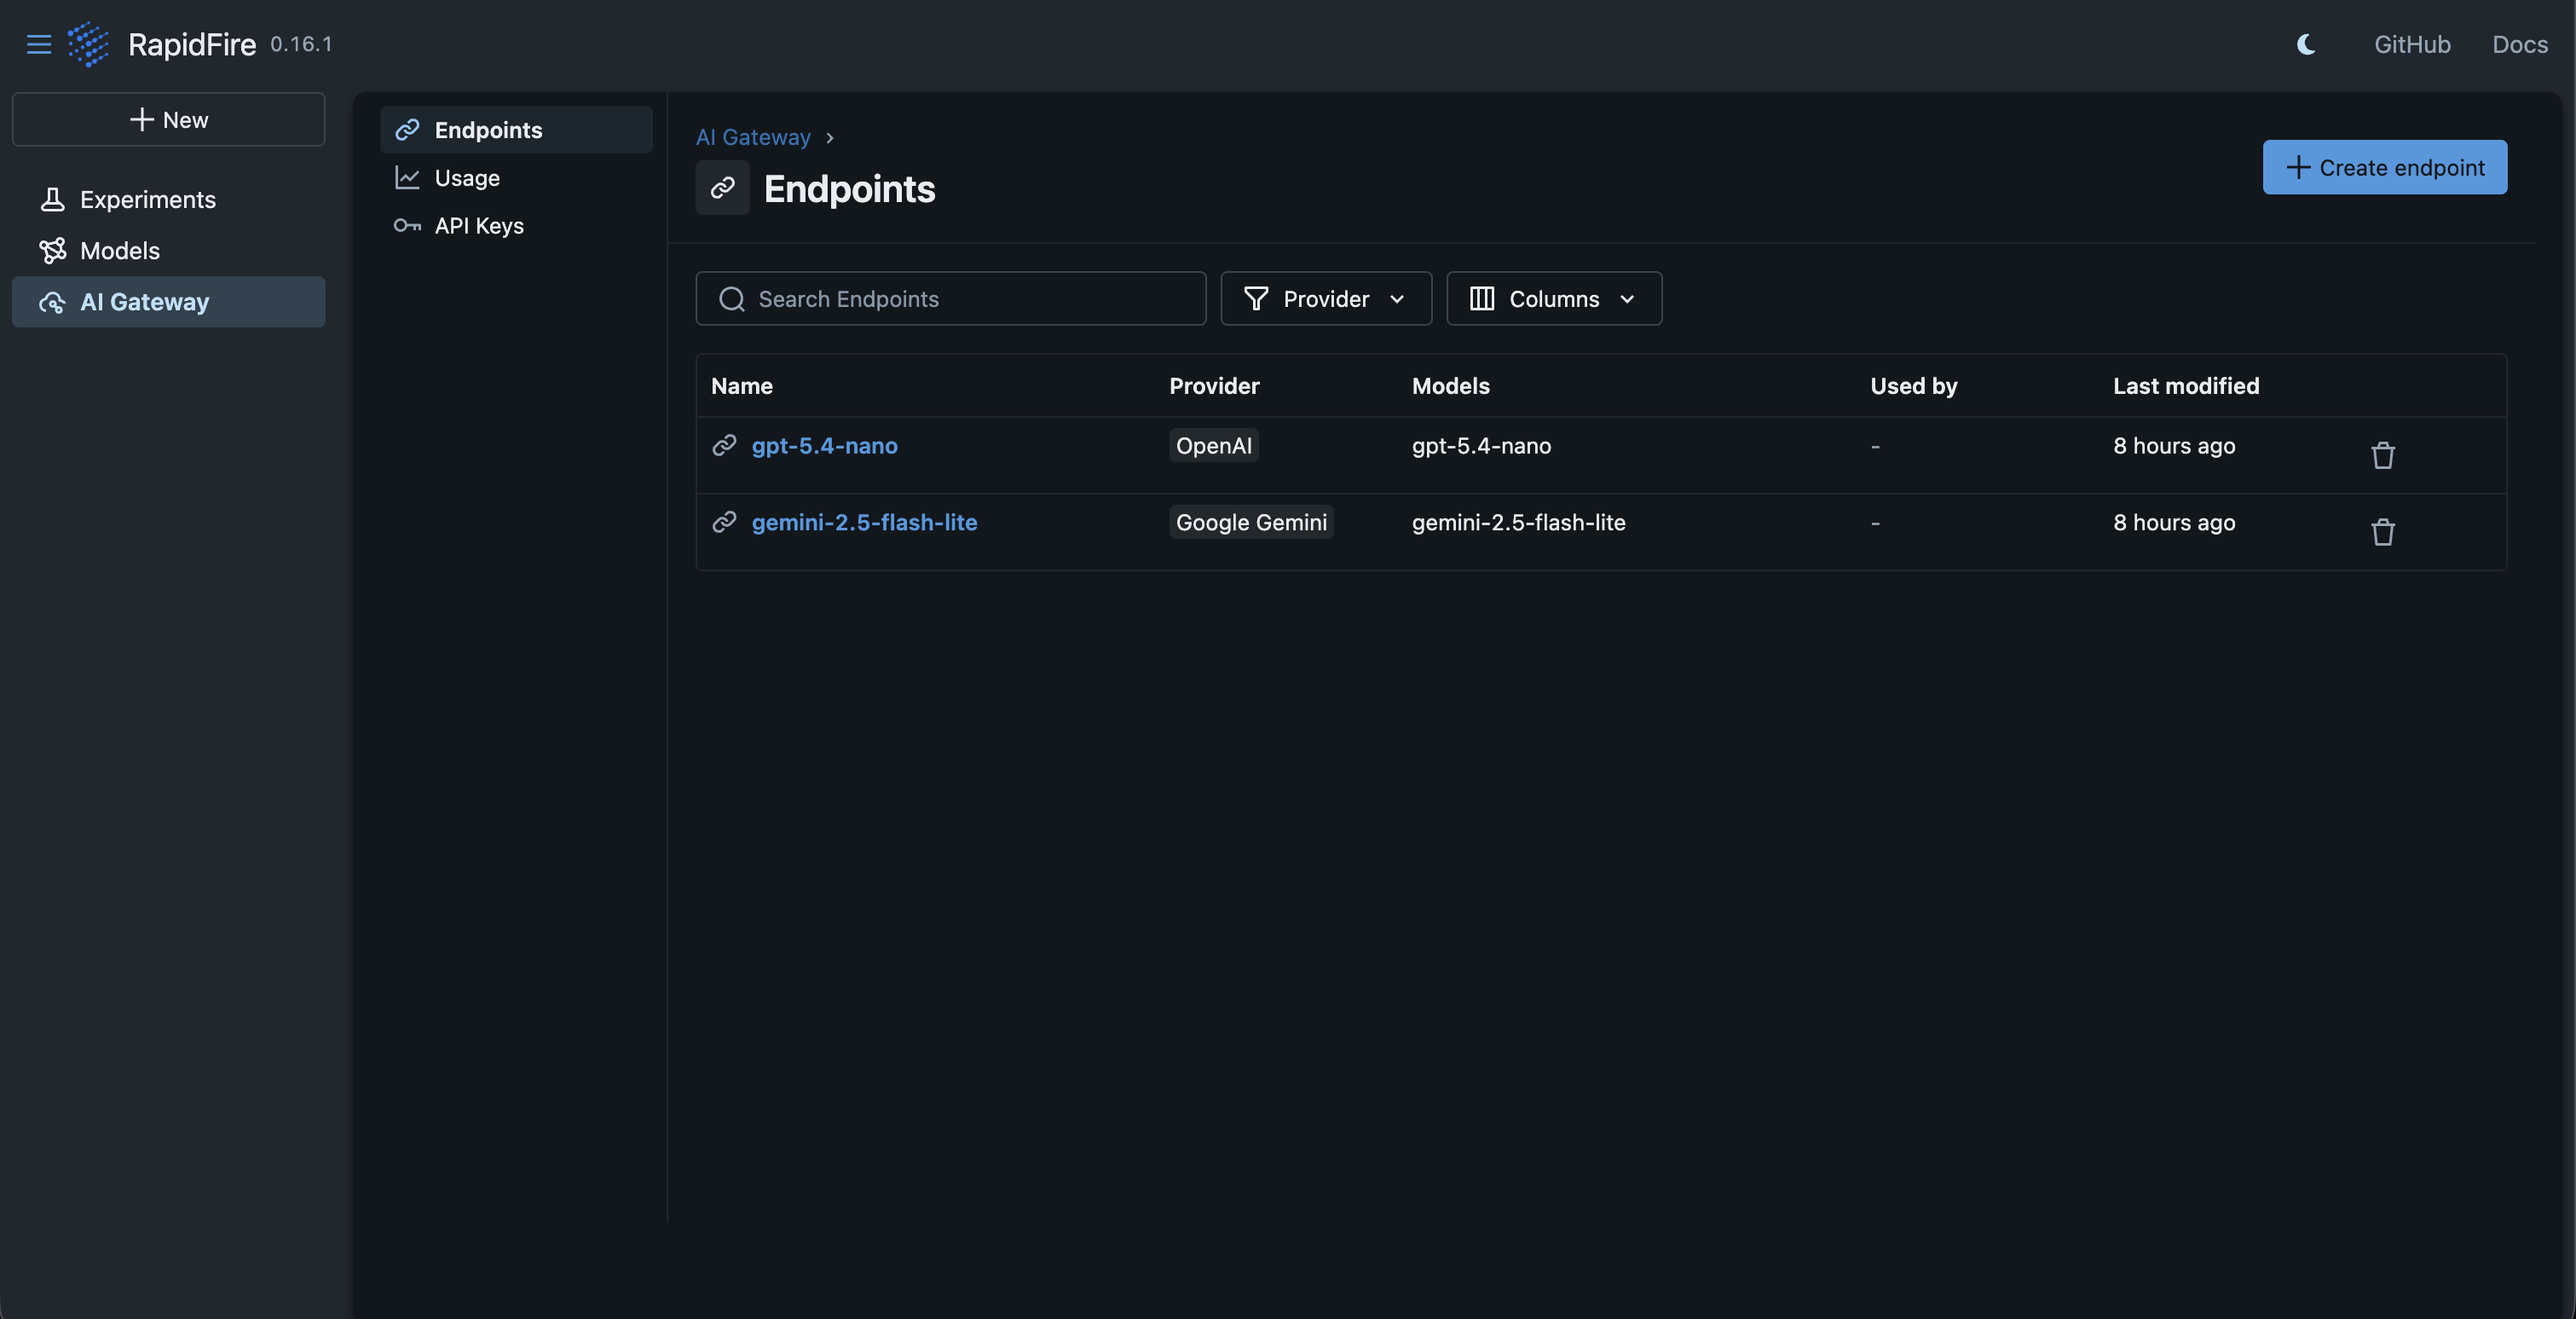
An endpoint is a named route to a specific provider and model that your generators call through the gateway. The Endpoints tab lists each endpoint with its name, provider, model(s), what it is used by, and when it was last modified.
Click Create endpoint to add one. You provide a unique endpoint name, choose the provider and model, and connect an API key (either create a new one or reuse an existing key for that provider). The model selector shows the model’s capabilities (e.g., Tools, Reasoning, Caching, Structured) along with a summary of its maximum input size and per-token cost. The Usage Tracking toggle controls whether requests to this endpoint are logged as traces; when enabled (the default), you can monitor usage, debug issues, and analyze performance from the Usage tab and the Traces view.
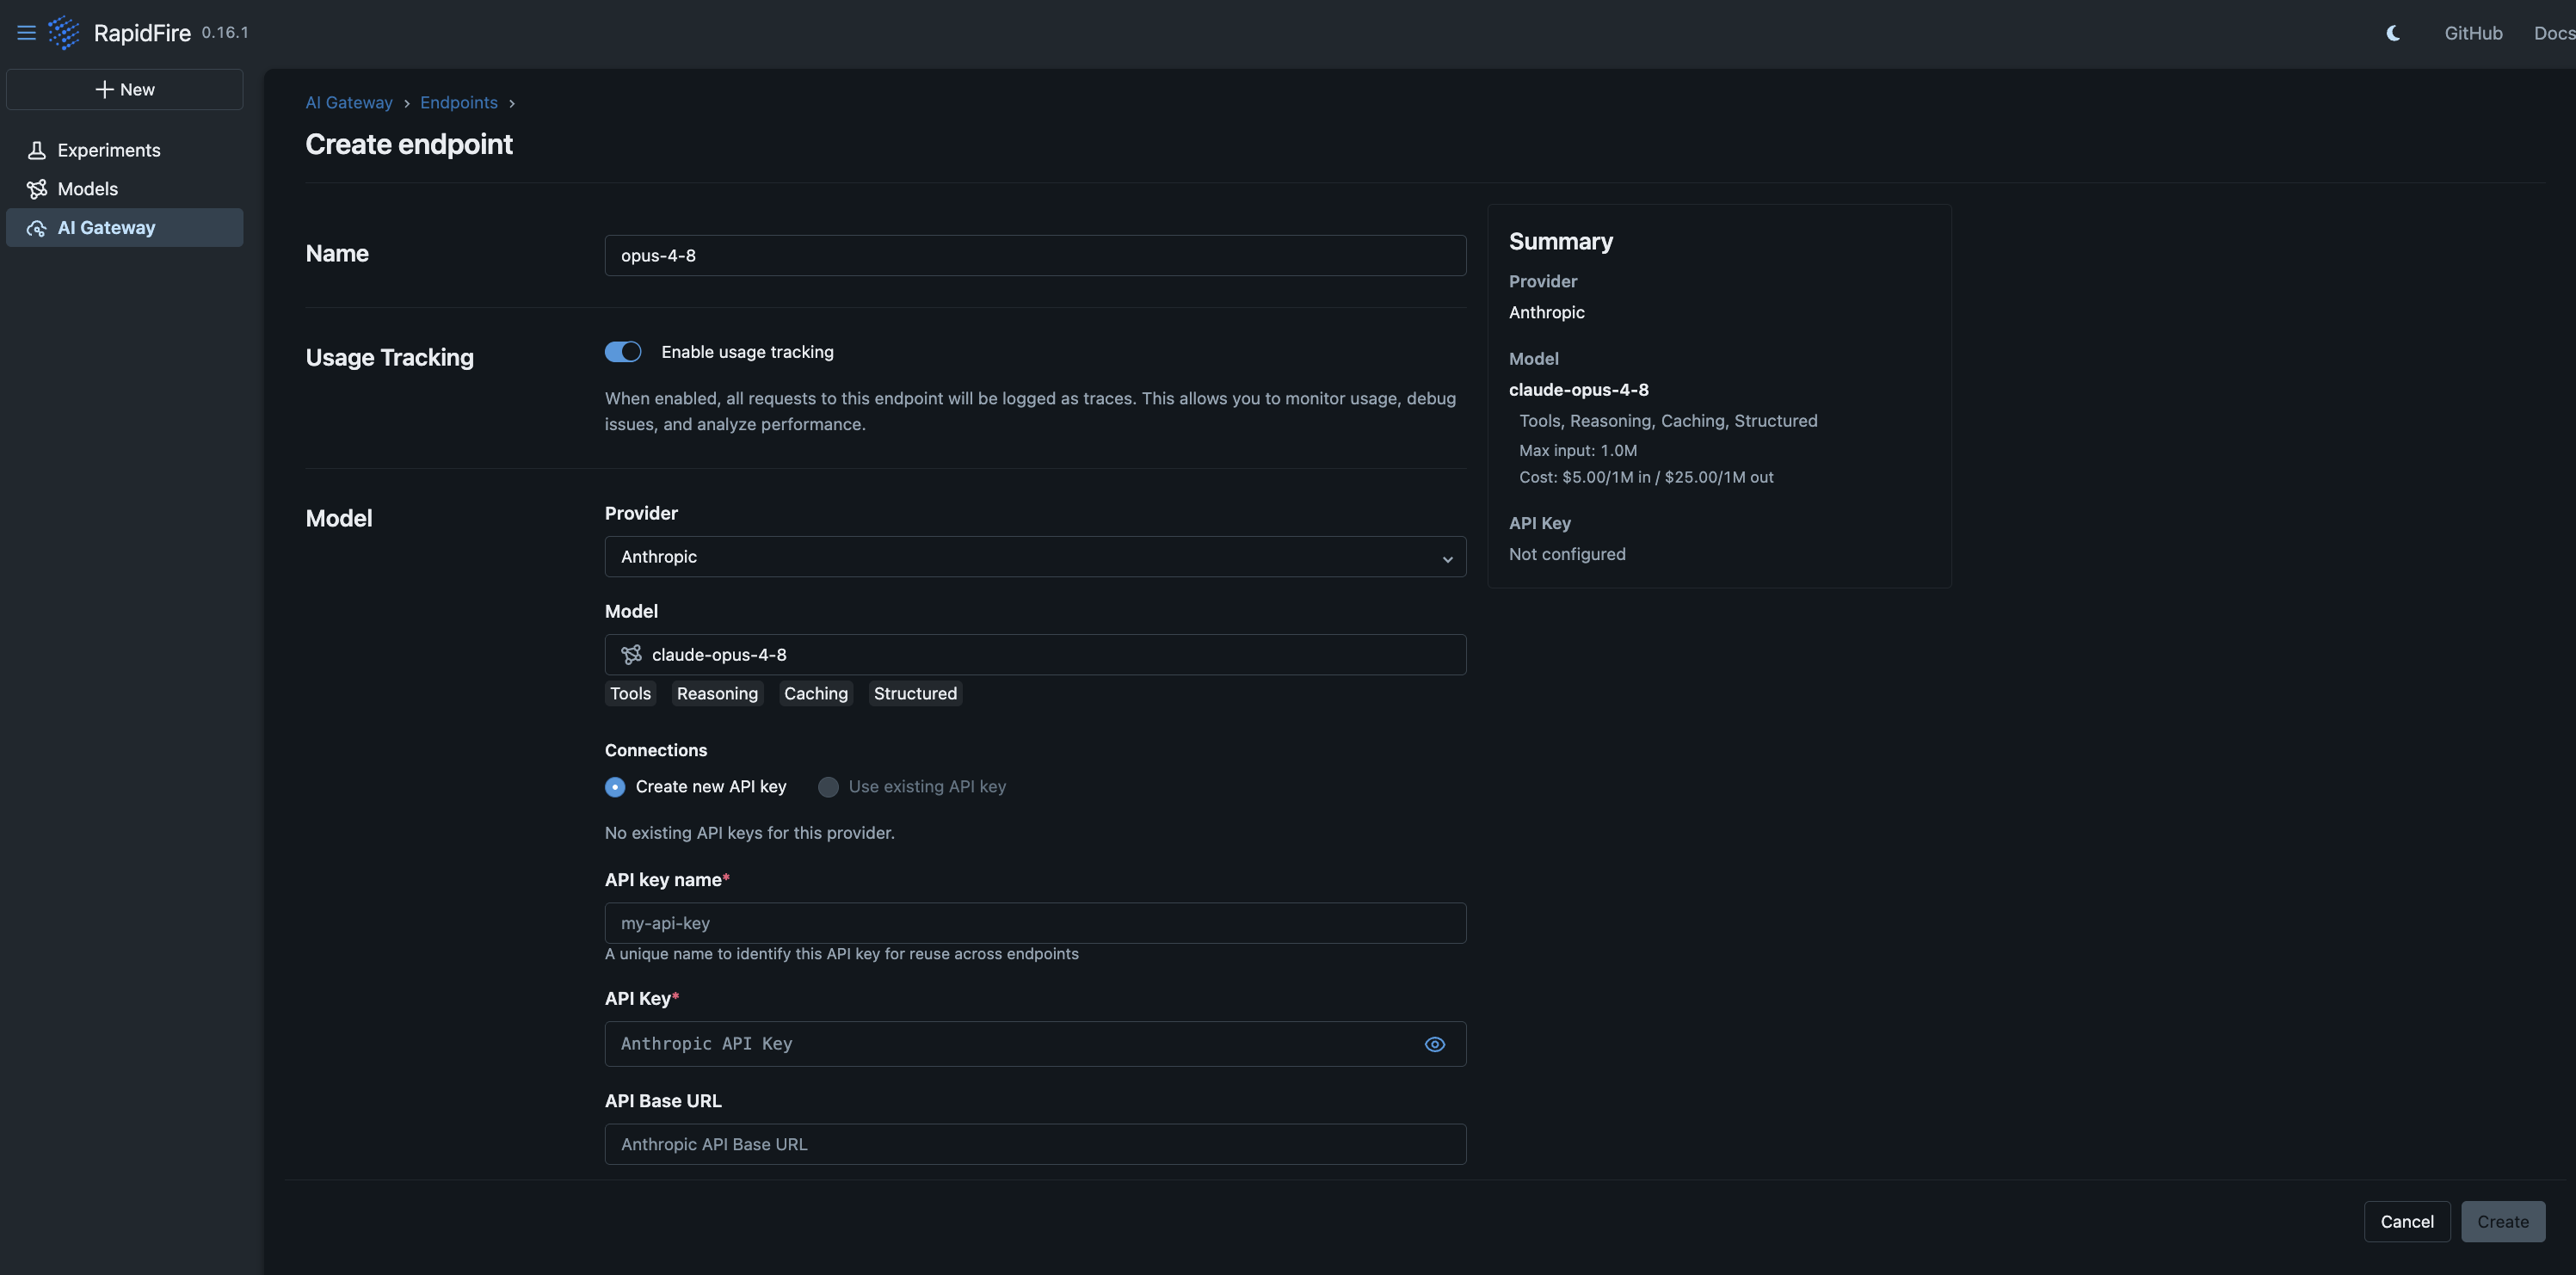
Programmatically, each endpoint corresponds to one entry in endpoint_config["endpoint"] of an
RFAPIModelConfig, where the endpoint dict’s name and model set the endpoint
name and model, and usage_tracking sets the toggle (defaults to True).
API Keys
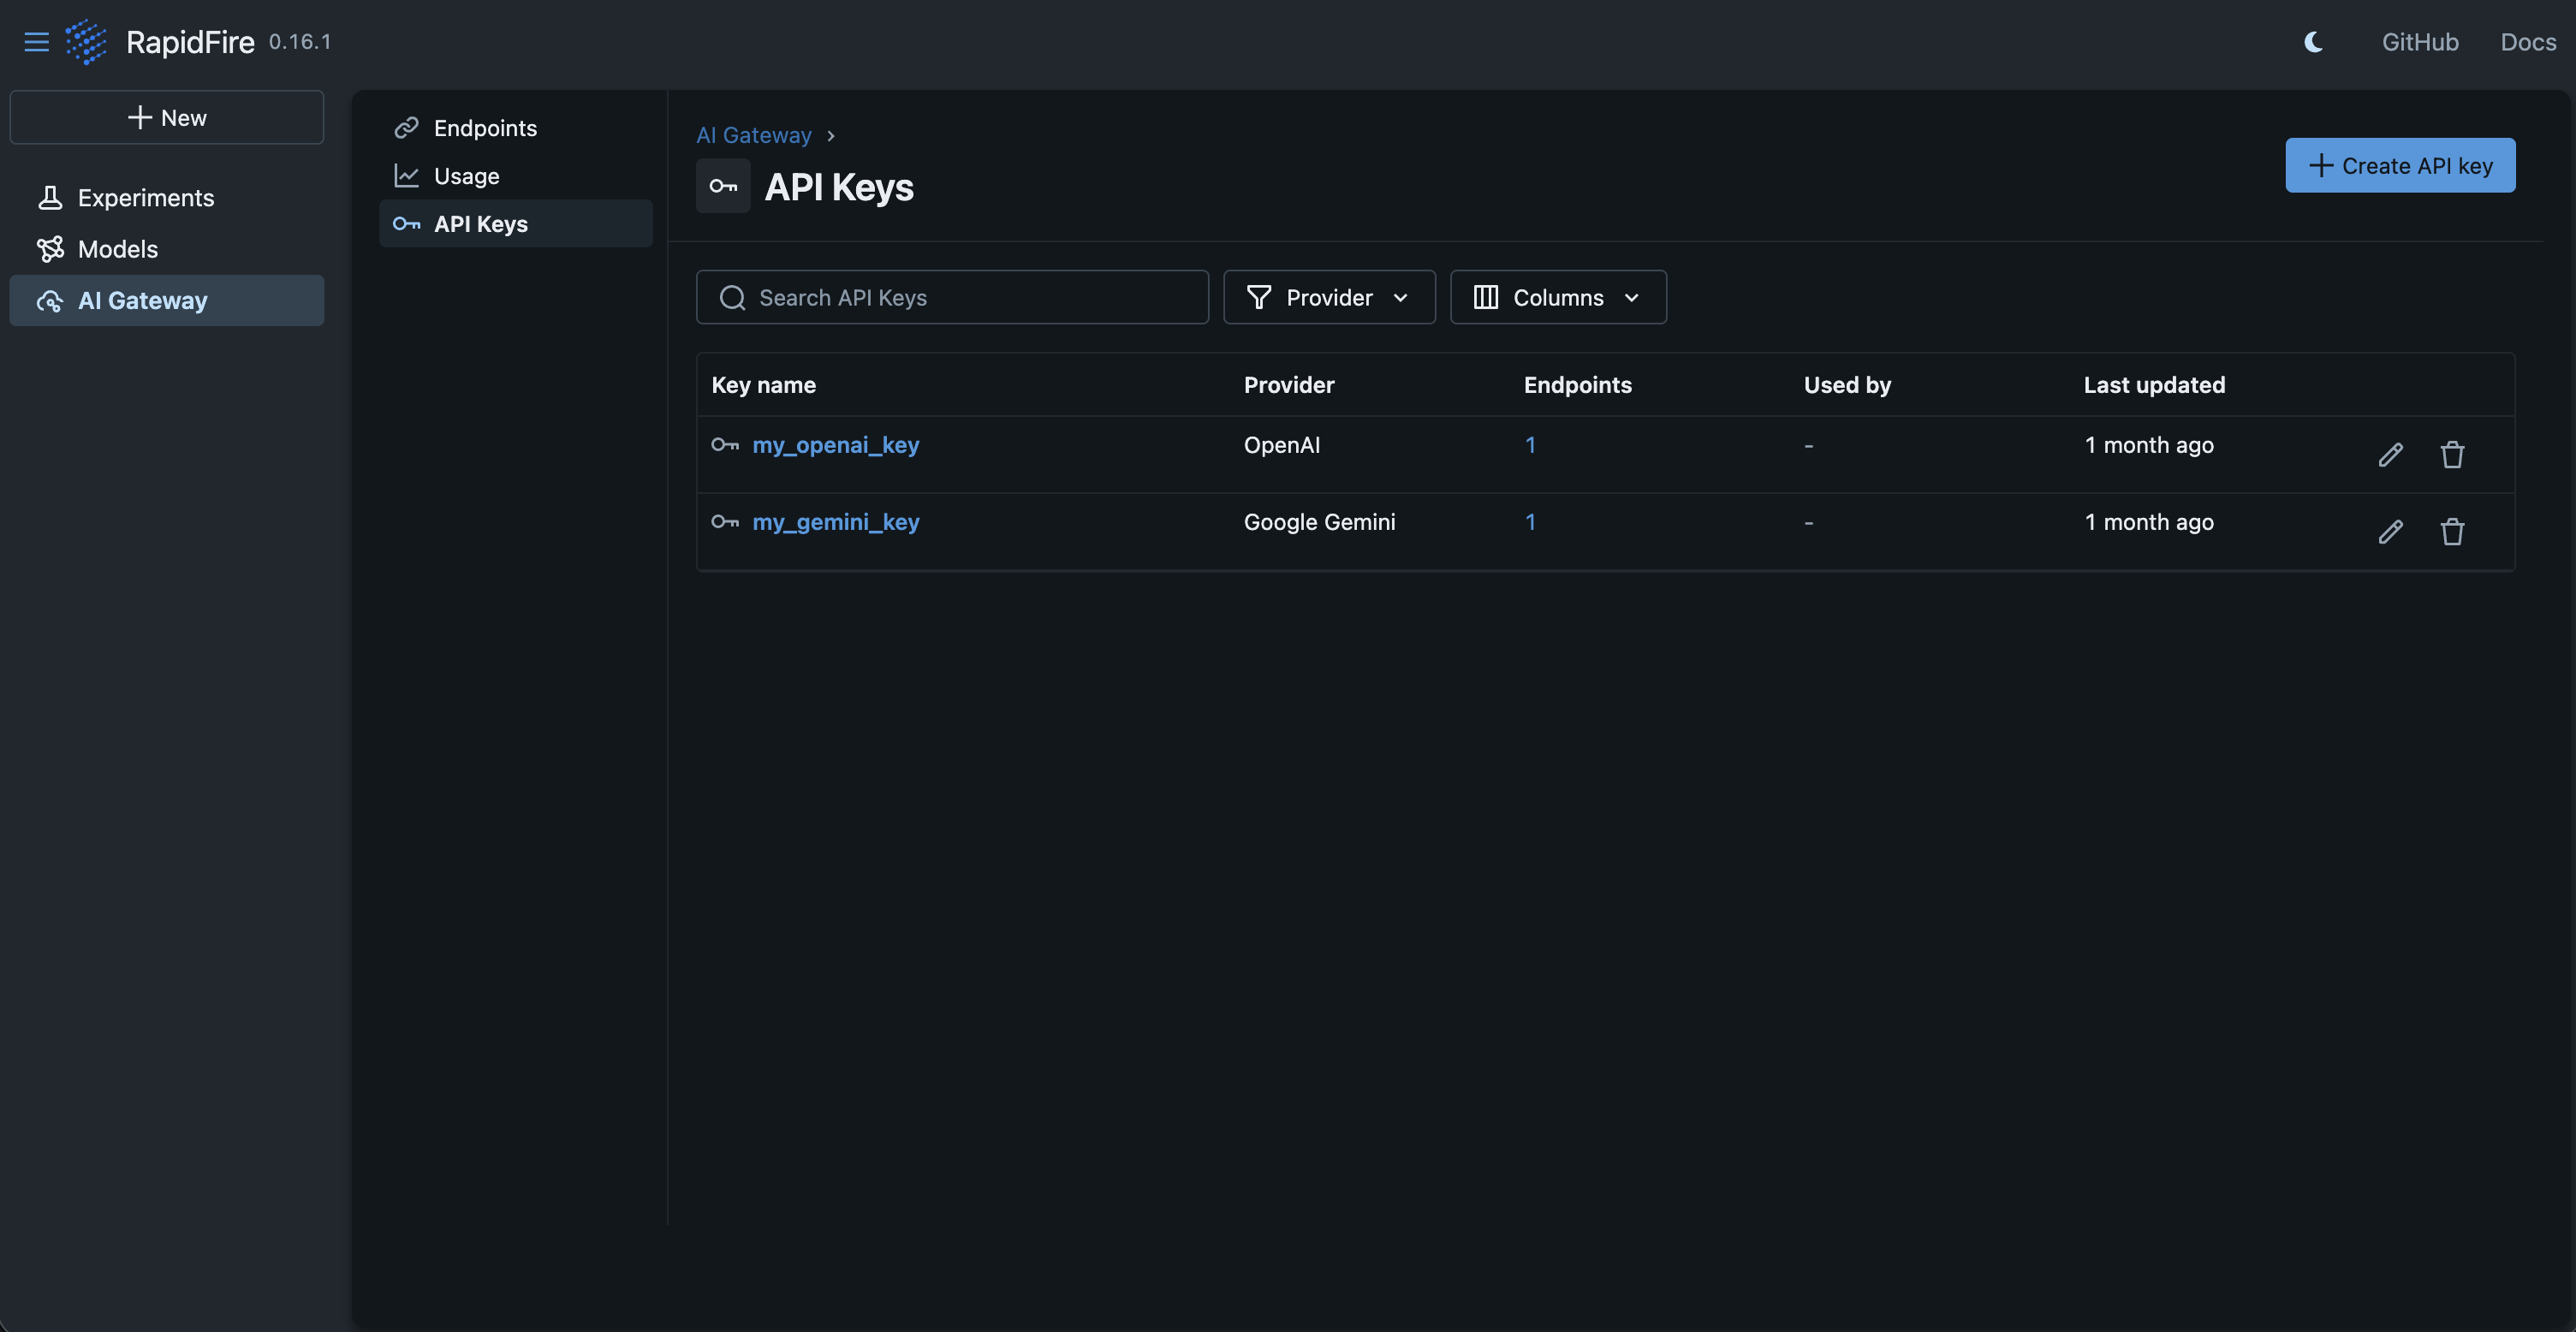
An API key is a named provider secret that the gateway stores once and reuses across endpoints. The API Keys tab lists each key by name and provider, the number of endpoints using it, and when it was last updated. Storing the key here means your endpoints reference it by name rather than embedding raw secrets.
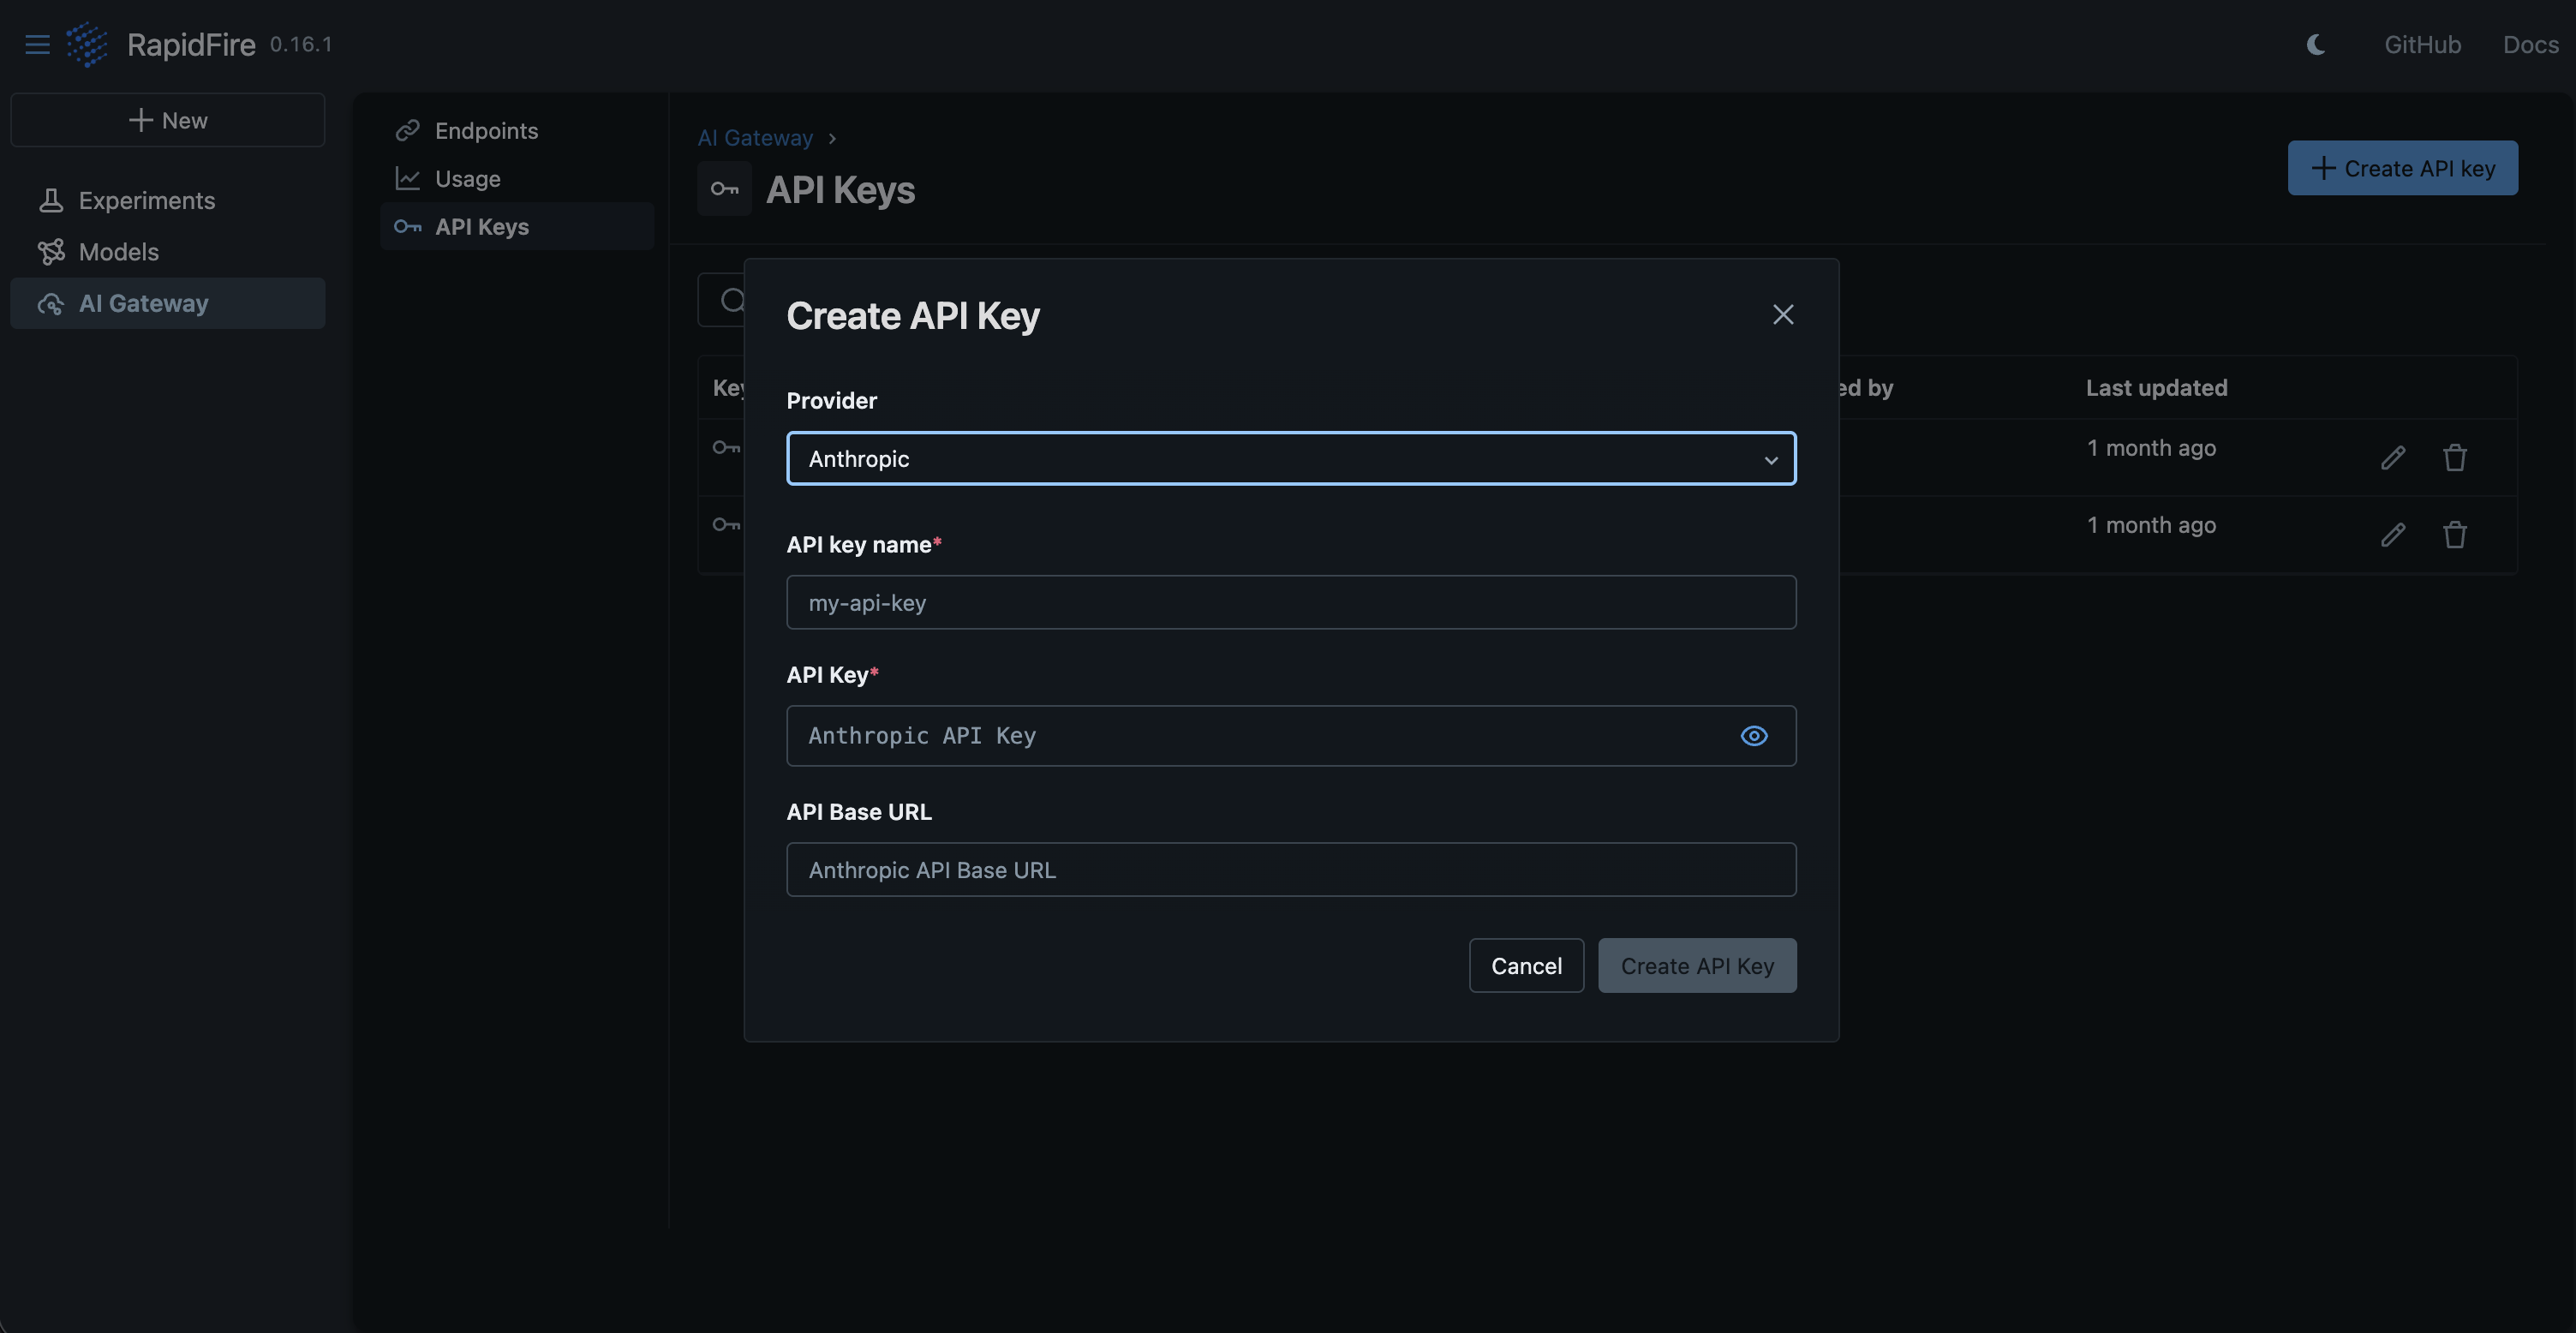
Click Create API key to add one. You choose the provider, give the key a unique name (used to reference it from endpoints), paste the provider API key, and optionally set a custom API base URL (for example, for an OpenAI-compatible endpoint).
Programmatically, an API key corresponds to endpoint_config["api_key_name"] (the name) and
endpoint_config["api_key"] (the secret value) of an RFAPIModelConfig. A key is created
only if one with that name does not already exist; otherwise the existing key is reused. If you reuse an
endpoint that was created with a different API key name, provisioning fails and asks you to resolve the
mismatch here in the UI.
Note
The API key value is required only when a key with that name does not yet exist. Once stored, later endpoints can reference the same key by name without re-supplying the secret.
Usage
The Usage tab summarizes traffic through the gateway so you can monitor cost and performance. Filter by a specific endpoint or view all endpoints together, and adjust the time unit and time range. The view reports the total number of Requests, Latency percentiles (p50, p90, p99), and Errors (both the error count and the overall error rate) over the selected window. A Logs sub-tab shows the individual request logs.
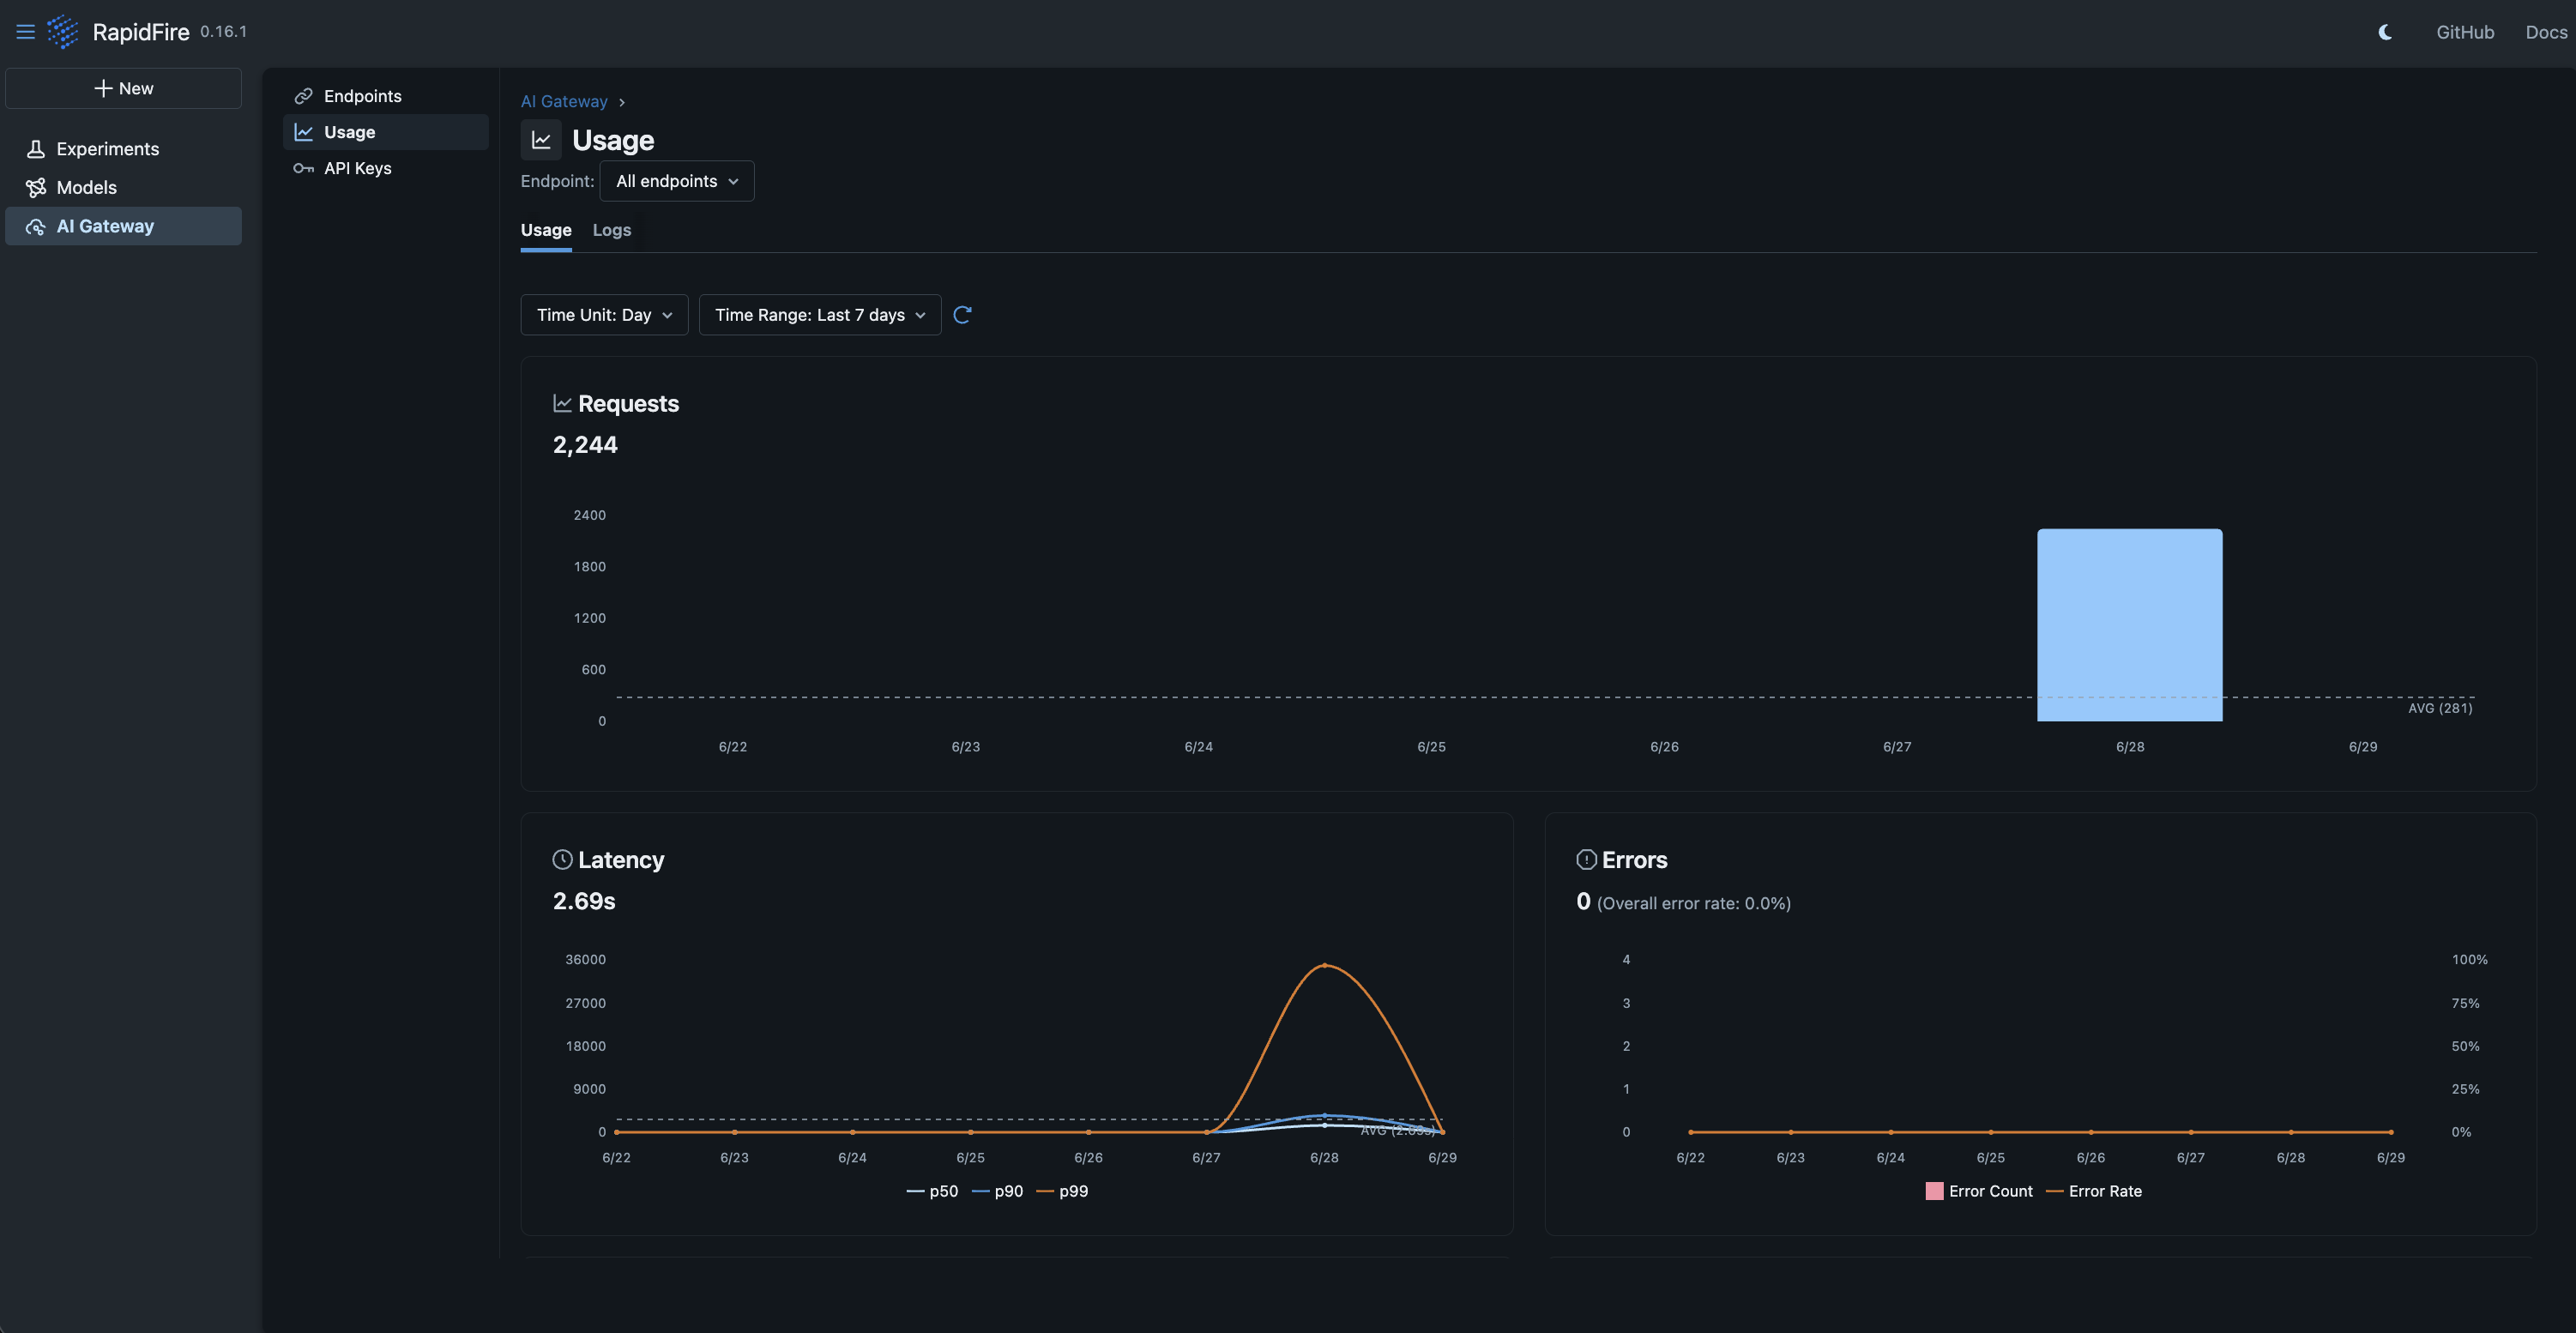
Usage data is recorded for an endpoint whenever its usage tracking is enabled. The same instrumentation feeds the per-call traces described on the ML Metrics Dashboard page, so you can move from an aggregate spike in latency or errors here to the individual traces behind it.